1. Introduction
The European sardine, Sardina pilchardus, and the Pacific and southern African sardine, Sardinops sagax, are the dominant small pelagic fishes of the Canary, California, Humboldt and Benguela current systems (Parrish et al., 1989). Their abundance fluctuates over decades in ways tied to ocean climate (Checkley et al., 2017), and managing them requires a view on how many self-sustaining units the fishery is drawing from. Along an upwelling coast that question is hard to settle. Fish school and migrate alongshore, spawning grounds shift with temperature, and management boundaries usually follow national borders or statistical areas and not biology.
No single method answers it. Current practice in stock identification is to combine markers that respond on different time scales: genetics for reproductive isolation over generations, and phenotypic markers such as morphometrics, parasites, otolith chemistry and otolith shape for separation within a lifetime (Begg and Waldman, 1999; Cadrin et al., 2014). Small pelagic fishes with large populations and high gene flow often show little genetic differentiation even where groups remain apart for most of their lives, and it is here that phenotypic markers earn their place.
Otolith shape is the cheapest of them. Otoliths are already collected for ageing in most monitoring programmes, and a calibrated photograph is all that is needed. The method was established by Campana and Casselman (1993) and has been applied to clupeoids, including herring (Burke et al., 2008) and the European sardine (Jemaa et al., 2015). This article proposes a stepwise procedure for a sardine study along an upwelling coast. It describes method and reasoning only; no samples were analysed.
2. Background: What Otolith Shape Records
The sagitta is the largest of the three pairs of otoliths in most teleosts and forms part of the organ of hearing and balance. It grows by daily accretion of calcium carbonate on a protein matrix and, unlike bone, is not resorbed, so its form is the cumulative outcome of the growth of the fish (Campana, 1999). Shape is species-specific enough for fish to be identified from their otoliths alone. Within a species it varies with ancestry and with environment, chiefly through the effect of temperature and food on growth rate.
The relative weight of the two influences has been examined directly. In known-age Atlantic cod reared under controlled conditions, Cardinale et al. (2004) found that both stock origin and rearing environment altered otolith shape. Working with a tropical fish introduced to new waters, Vignon and Morat (2010) concluded that environment and genetics act on different parts of the outline. The implication for an upwelling coast is direct. Persistent alongshore gradients in temperature and productivity will tend to produce differences in otolith shape between fish that spend their lives in different sectors, whether or not they are genetically distinct. Shape therefore identifies phenotypic stocks: groups with different life histories, which is the level at which most assessment models operate.
3. The Proposed Procedure
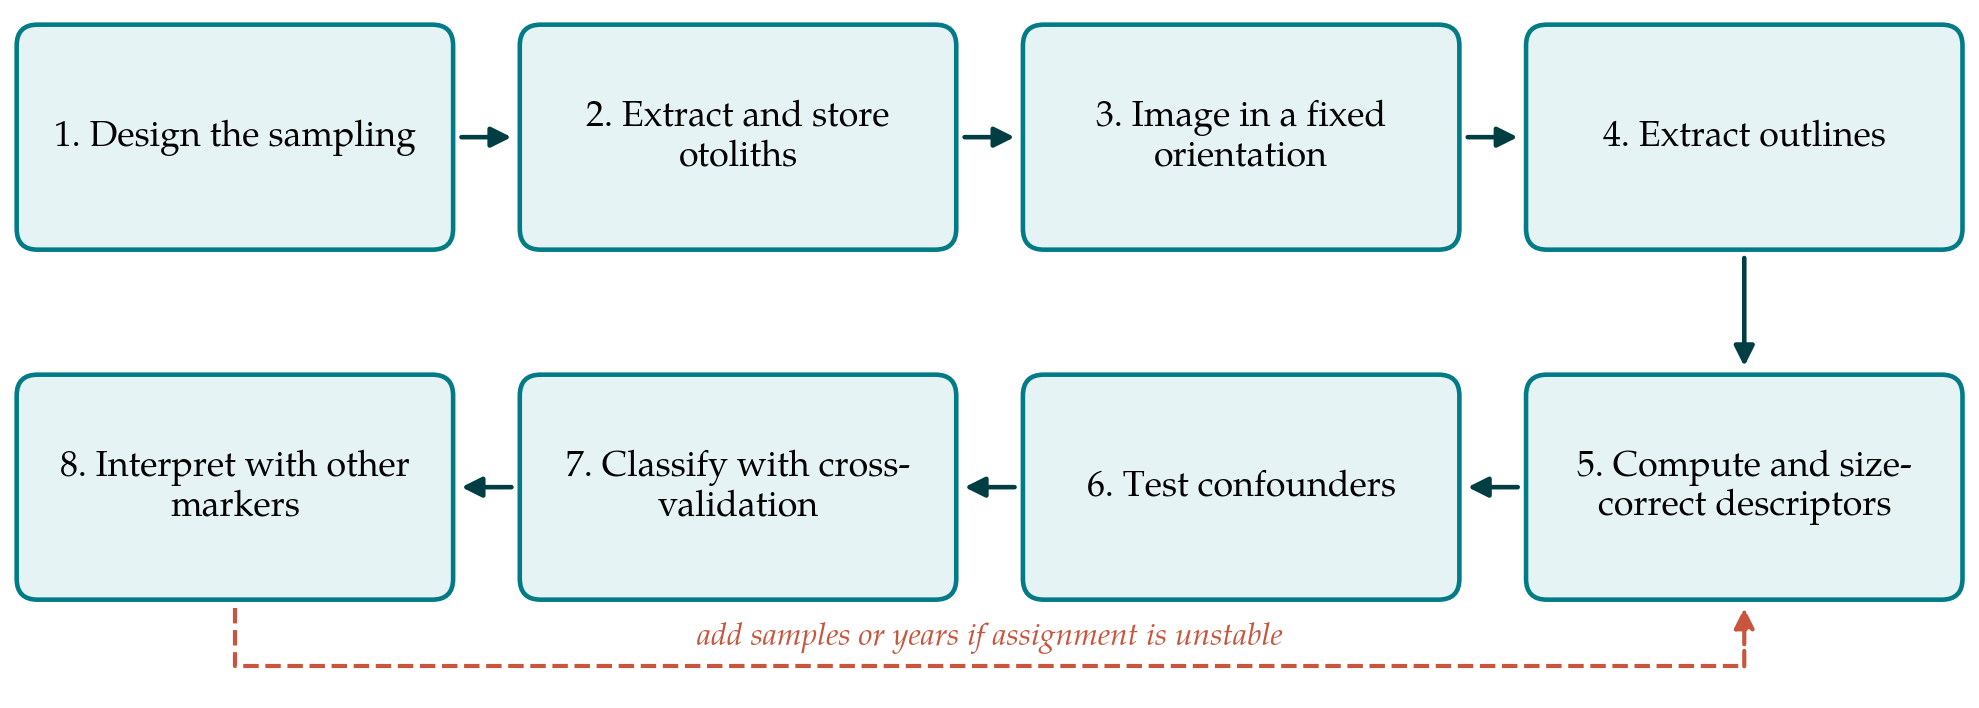
The procedure has eight steps, shown in Figure 1. They are described in order below. The choice of shape descriptor in the fifth step is the one most debated in the literature, and the options are compared in Table 1.
| Descriptor | What it captures | Strength | Limitation |
|---|---|---|---|
| Linear measures | Length, width, area and perimeter of the otolith | Simple; comparable across laboratories | Mostly reflect size; little shape information |
| Shape indices | Overall form as ratios of the linear measures | Few variables; easy to interpret | Insensitive to local features of the outline |
| Elliptic Fourier descriptors | Whole outline as a harmonic series | Complete; outline can be reconstructed | Many correlated coefficients; harmonics lack a location |
| Wavelet coefficients | Outline at several scales with position retained | Shows where on the outline groups differ | Depends on the choice of wavelet and starting point |
| Landmark geometry | Positions of defined points such as rostrum tip | Direct anatomical meaning | Few reliable landmarks on a sardine otolith |
3.1. Step 1: Design the sampling
Most failures of shape studies originate here. Otolith shape changes with fish length, age and, in some species, sex and year class (Campana and Casselman, 1993; Cardinale et al., 2004). If the samples from two areas differ in any of these, an apparent difference between areas may be nothing more than a difference in the fish sampled. The design should therefore take fish from each candidate area within a common, restricted length range, record sex and maturity, age the fish, and sample every area in more than one year. Because sardine mix on feeding grounds, fish caught on the spawning grounds during the spawning season give the cleanest baseline, with feeding-season samples treated as mixtures to be assigned. Areas should be chosen to span the suspected boundaries, such as major capes, upwelling cells or gaps in spawning habitat.
3.2. Step 2: Extract and store the otoliths
Both sagittae are removed, cleaned of tissue in water, dried and stored dry in labelled vials. Sardine otoliths are small and fragile, and the thin anterior projection, the rostrum, breaks easily. Broken or crystalline otoliths are excluded, and the exclusion rate is recorded by area. One side, by convention the left unless damaged, is used throughout. Fish length, weight, sex, maturity stage, capture position and date are entered against each otolith.
3.3. Step 3: Image in a fixed orientation
Each otolith is photographed under a stereomicroscope with the same face uppermost and the rostrum pointing in the same direction, against a contrasting background, at a magnification that fills most of the frame. A stage micrometer is photographed at the start of every session for calibration. Standardising the orientation matters more than the choice of lighting, since a tilted otolith yields a different projected outline. A subset should be re-imaged on another day by a second operator to measure repeatability.
3.4. Step 4: Extract the outlines
The image is converted to a binary silhouette by thresholding and the boundary is traced as a closed sequence of coordinates. General image-analysis software can do this (Schneider et al., 2012), and the R package of Libungan and Pálsson (2015) automates it for otoliths, including checks for outlines corrupted by debris or uneven lighting. Every outline should be inspected overlaid on its image before it is accepted. Light smoothing removes pixel noise.
3.5. Step 5: Compute descriptors and correct for size
Three families of descriptor are in use. Shape indices are ratios built from area, perimeter and the axes of the outline, such as circularity, rectangularity and aspect ratio. Elliptic Fourier analysis decomposes the outline into a series of harmonics, each defined by four coefficients, and the coefficients can be normalised so as to be invariant to size, rotation and starting point (Kuhl and Giardina, 1982). Wavelet analysis represents the outline at several scales and locates differences along it (Libungan and Pálsson, 2015).
The proposal is to compute shape indices and elliptic Fourier descriptors for every otolith, and wavelets where the software is available. The number of harmonics retained is set by the cumulative Fourier power, keeping enough to reconstruct the average outline to a stated high percentage (Crampton, 1995). Normalised coefficients are free of size as a scale, but not of allometry, the change of shape with size. Each descriptor is therefore regressed on fish length within groups. Descriptors whose relation to length differs between areas are discarded, since no common correction exists for them, and the remainder are adjusted to a standard length (Lleonart et al., 2000).
3.6. Step 6: Test confounding factors
Before areas are compared, the retained descriptors are tested for effects of sex, age, year class and sampling year, using analysis of variance or its permutational equivalent. If shape differs between year classes within an area, comparisons between areas must be made within year class. If it differs between sampling years by as much as between areas, the spatial signal is not stable enough to serve as a baseline, and the study should say so. This step is often omitted, and its omission is the main reason that published classification rates are hard to reproduce.
3.7. Step 7: Classify with cross-validation
Differences between areas are displayed by an ordination, for which canonical analysis of principal coordinates is suitable (Anderson and Willis, 2003), and quantified by a classifier. Linear discriminant analysis remains the standard; random forests make fewer distributional assumptions and handle correlated predictors (Breiman, 2001). Whichever is used, performance must be estimated on fish not used to build the rule, by leave-one-out or repeated k-fold cross-validation, with every step that used the data, including the choice of descriptors, repeated inside each fold. The cross-validated rate is compared with the rate expected by chance given the sample sizes, and reported as a confusion matrix by area. Assignment that is good in one year and poor when the rule is applied to another year indicates overfitting or instability.
3.8. Step 8: Interpret alongside other markers
A shape difference shows that the fish of two areas have had different histories. It does not show reproductive isolation, and the absence of a difference does not show mixing. The result should be read with whatever else is known: the distribution of eggs and larvae, length at maturity, parasites, otolith chemistry, genetics and tagging where available (Begg and Waldman, 1999; Cadrin et al., 2014). Agreement between independent markers is what justifies a change to assessment units. Applications to horse mackerel (Stransky et al., 2008) and herring (Burke et al., 2008) illustrate how shape has been used in this supporting role.
4. Fitting the Procedure to an Upwelling Coast
Three features of upwelling systems call for particular care. The first is that the environmental gradient is itself variable. The intensity of upwelling changes between years and decades, and a baseline built in a cool period may not hold in a warm one. Baselines should be renewed regularly and matched by year class to the fish being assigned. The second is alongshore movement: sardine may be spawned in one sector and recruit to the fishery in another, so the outline of an adult integrates conditions from several places. Restricting the analysis to a narrow age range reduces the ambiguity. The third is that sardine and other small pelagics expand and contract their range with abundance, so that boundaries evident at low biomass may disappear at high biomass.
5. Limitations and What Remains to Be Shown
This procedure is proposed and has not been validated here. Its steps follow published methods, but whether they yield reliable discrimination for sardine on a given coast is an empirical matter. A validation would need baseline samples of spawning fish from each candidate area in at least three years, classification rules built in one year and tested on the others, and a comparison of the shape result with an independent marker on the same individuals. It would also need a measure of imaging repeatability between operators.
Some limits are inherent. Shape is a phenotypic marker and cannot distinguish a plastic response from an inherited one. Classification rates fall as the number of candidate areas rises, and with small otoliths the measurement error is not negligible relative to the differences sought. The method is best regarded as a screening tool that indicates where more expensive markers should be applied.
6. Conclusion
Otolith outlines can be obtained at little cost from material that sardine monitoring programmes already collect, and the analytical tools are freely available. The eight-step procedure proposed here puts the emphasis where shape studies most often go wrong: in the sampling design, the control of size and age effects, and the honest estimation of classification error. Applied in that way, and read together with other evidence, otolith shape is a reasonable first test of the stock boundaries assumed along an upwelling coast. Its performance for any particular sardine population has still to be demonstrated.
Conflict of interest
To be declared by the author(s) before publication.
Funding
To be declared by the author(s) before publication.