1. Introduction
A shopper who reaches the checkout has found a product, accepted a price and expressed an intention to buy. Losing that shopper to a confusing address form or a payment error is the most avoidable kind of lost sale. Online retailers have long monitored the checkout with funnel reports, which count how many sessions pass from cart to delivery details to payment to confirmation. A funnel report locates the leak by step. It says nothing about the cause, because it treats each step as a single event when it is in fact several dozen interactions.
Not all abandonment is the retailer's doing. Shoppers use carts to store items, to compare totals and to wait for a better price, and many leave for reasons that no form design could change (Kukar-Kinney and Close, 2010). The task for measurement is to separate that background from abandonment that follows difficulty with the process itself. This article uses the word friction for the second kind: effort, error or delay that the interface imposes on a user who is trying to complete the purchase.
Session replay data and sequential pattern models suit this task, the first because it records what happens inside each step and the second because it finds regularities in ordered events. This article sets out a procedure that joins them. It is a methodological proposal. No dataset is analysed and no performance is claimed, and the closing sections state what would have to be shown before the procedure could be relied upon.
2. Background
Three matters need to be set out before the procedure: what friction means in usability terms, what a replay tool records, and which models find structure in ordered events.
2.1. Friction as a usability concept
The standard definition of usability is the extent to which specified users can achieve specified goals with effectiveness, efficiency and satisfaction in a specified context of use (ISO, 2018). Friction, in these terms, is a shortfall in effectiveness or efficiency: the user fails, or succeeds at greater cost in time and actions than the task requires. Marketing research on clickstreams reached a similar view from another direction. Sismeiro and Bucklin (2004) modelled online purchase as a series of tasks that the visitor must complete in turn, and showed that what visitors do and encounter at each task helps to predict whether they complete the next.
2.2. What session replay records
Conventional clickstream data record page requests, and a substantial literature models them: typologies of visits by navigation pattern (Moe, 2003), path models that predict conversion from the sequence of pages viewed (Montgomery et al., 2004), and reviews of the field (Bucklin and Sismeiro, 2009). Session replay works at a finer grain. A script in the page logs changes to the document, pointer and touch events, scrolling, focus and input on form fields, and errors, each with a timestamp, so that the session can be reconstructed and viewed. Vendors derive from these logs signals such as repeated rapid clicks on one element or clicks on elements that do not respond. The raw record is rich, but it is used mostly by watching individual sessions, which does not scale and invites selective attention.
2.3. Sequential pattern models
Sequential pattern mining was introduced by Agrawal and Srikant (1995) to find subsequences that occur in at least a minimum share of customer sequences, a share called support. Their later GSP algorithm added time and gap constraints (Srikant and Agrawal, 1996). SPADE reorganised the search around a vertical data format (Zaki, 2001) and PrefixSpan avoided candidate generation by growing patterns from projected databases (Pei et al., 2004); a survey of the family is given by Fournier-Viger et al. (2017). Three neighbouring ideas are also used below. Emerging patterns are those whose support differs sharply between two datasets (Dong and Li, 1999). Hidden Markov models represent a sequence as the output of a small number of unobserved states (Rabiner, 1989). Process mining offers related tools for comparing recorded behaviour with an intended process model (van der Aalst, 2016).
3. The Proposed Procedure
The procedure has seven steps. Figure 1 shows their order and Table 1 lists the output and the main pitfall of each.
| Step | Output | Main pitfall |
|---|---|---|
| 1. Define funnel and outcome | Written definitions of checkout start, completion and abandonment | Counting shoppers who return later as abandoners |
| 2. Capture events | Event log with sensitive fields masked at source | Recording personal or payment data |
| 3. Encode alphabet | Dictionary mapping raw events to a few dozen symbols | Alphabet so fine that every pattern is rare |
| 4. Assemble and label | One labelled sequence per checkout attempt | Mixing devices and interface versions in one corpus |
| 5. Mine and contrast | Ranked patterns over-represented among abandoned attempts | Spurious patterns from many comparisons |
| 6. Model and index | Transition model and a friction index for each step | Reading the index as a causal effect |
| 7. Confirm | Reviewed replays and experiment results for leading patterns | Changing the interface on unconfirmed patterns |
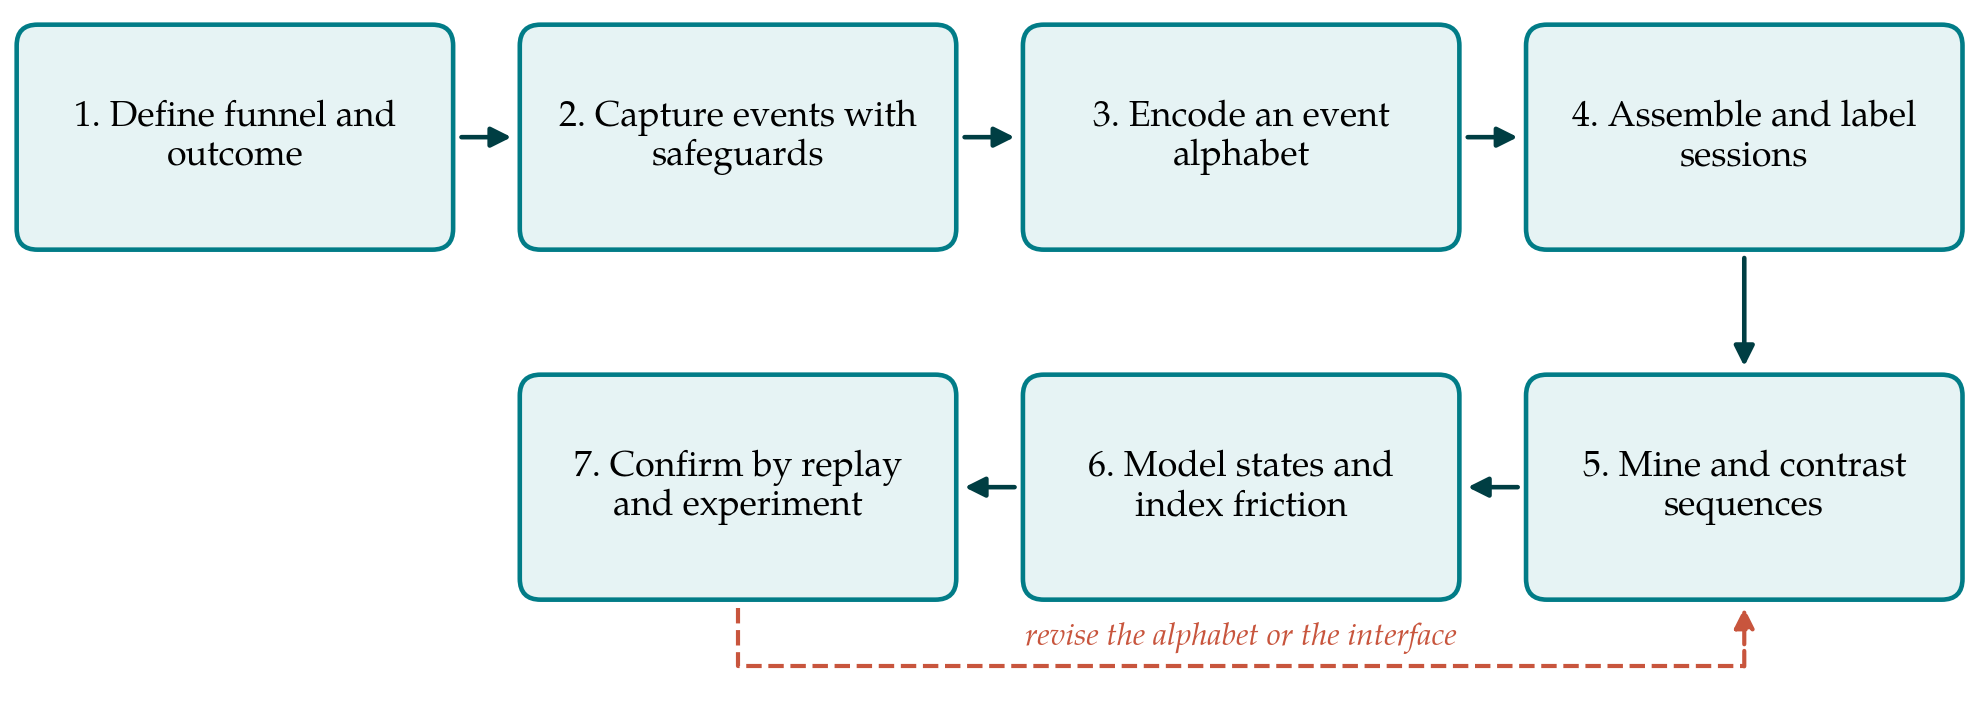
The first step fixes definitions. Checkout begins at a named event, usually the first view of the delivery or payment form, and ends in completion when the order confirmation is recorded. Abandonment needs a rule: a checkout attempt is treated as abandoned if no completion follows within the session, where a session is closed by an inactivity timeout of the kind long used in web usage mining (Cooley et al., 1999). Shoppers who leave and complete the purchase later, perhaps on another device, will be miscounted unless attempts can be linked by account or order, and the definition should state how such cases are handled.
The second step captures the events. Replay scripts can record everything typed into a form, and a checkout form contains names, addresses and card details. Capture must therefore be configured so that field contents are masked before they leave the browser and only the fact, timing and validity of an input are retained. The procedure needs no more than that. The section on privacy and governance returns to the conditions under which such recording is acceptable.
Raw replay events are too varied to mine directly. The third step maps them to a compact alphabet in which each symbol names an action on a class of element: focus on the postcode field, an edit, a validation error on the card number, a tap on the pay button, a tap with no response, a change of delivery option, a scroll back to an earlier section, a switch to another application. Durations are discretised into symbols for long pauses. The alphabet is the main modelling decision. If it is too fine, every pattern is rare; if it is too coarse, a field that causes trouble cannot be told from one that does not. A few dozen symbols is a reasonable starting size, to be revised after the first pass.
In the fourth step events are grouped into checkout attempts and each attempt becomes one sequence labelled completed or abandoned. Sequences should be kept in separate corpora by device class and by interface version, because the same symbol can mean different things on a phone and on a desktop, and because a pattern that reflects a layout since corrected is of no interest. Automated traffic is removed at this point as part of ordinary data cleaning (Cooley et al., 1999).
The fifth step mines the sequences. A pattern-growth algorithm such as PrefixSpan is run on the abandoned and the completed corpora with a modest minimum support and a maximum gap between consecutive symbols, so that patterns describe behaviour that is close together in time (Pei et al., 2004). For each frequent pattern the support in the two corpora is compared. Patterns much more common among abandoned attempts are the candidates of interest, in the sense of emerging patterns (Dong and Li, 1999). Because thousands of patterns are compared, the differences should be controlled for multiple testing, for which the false discovery rate is the natural criterion (Benjamini and Hochberg, 1995), and the surviving patterns should be checked for stability on a later period of data.
Pattern lists are hard to communicate, so the sixth step summarises them in two forms. One is a transition model: a first-order Markov chain over the symbols, or a hidden Markov model with a handful of states that can be read as progressing, correcting, hesitating and leaving (Rabiner, 1989). The time a session spends in the correcting and hesitating states, and the probability of leaving from them, describe friction step by step. The other form is a friction index, defined in the next section. Either summary can be tracked over time in the way that funnel conversion already is.
The final step tests the candidates. Analysts watch a small random sample of replays that contain each leading pattern and a sample that do not, to see whether the pattern corresponds to a recognisable difficulty and what in the interface produces it. Patterns that survive this review become hypotheses for change, and the change is evaluated by a controlled experiment with completion as the outcome (Kohavi et al., 2020). Only at this stage is a causal statement justified. A pattern associated with abandonment may mark shoppers who were never going to buy, and a design change is the way to find out.
4. A Friction Index
A single number per checkout step is useful for monitoring, provided its construction is transparent. One simple proposal is as follows. Let the confirmed friction patterns for a step be those that passed the review in step seven. The index for the step in a given period is the share of checkout attempts reaching that step in which at least one confirmed pattern occurs. It rises when more shoppers meet a known difficulty and falls when a fix takes effect. A weighted variant multiplies each pattern by its growth rate, the ratio of its support among abandoned attempts to its support among completed ones, so that patterns more strongly tied to leaving count for more.
The index is descriptive. It measures the prevalence of behaviours that have been judged to indicate difficulty, and it inherits every weakness of that judgement. It should be reported alongside the completion rate and never in place of it, and its pattern set should be derived afresh whenever the interface changes materially, since new designs produce new ways of going wrong. Comparing index values between different retailers, or between phone and desktop, is not meaningful unless the alphabets and pattern sets are the same.
5. Privacy and Governance
Session replay is among the more intrusive forms of web analytics, and the procedure is acceptable only within clear limits. Under the General Data Protection Regulation, personal data must be adequate, relevant and limited to what is necessary for the purpose, and controllers must build data protection into the design of their processing (European Union, 2016). For the present purpose the necessary data are event types, element classes and timings. Field contents, free-text entries and anything displayed on the payment form are not needed and should be masked in the browser. Retention can be short, because the sequences are aggregated into patterns soon after collection.
Three governance practices follow. The alphabet dictionary should be reviewed with the organisation's data protection function, since it is the precise statement of what is kept. Access to viewable replays, as distinct from encoded sequences, should be restricted to the few analysts who perform the confirmation step. And shoppers should be informed that interaction recording takes place and offered whatever choice the applicable law requires. Requirements differ between jurisdictions, and this article does not offer legal advice.
6. Limitations and What Remains to Be Shown
The procedure is a proposal built from published components, and it has not been validated here. Its central assumption is that difficulty leaves a recognisable trace in interaction sequences, and that the trace differs from the behaviour of a shopper who is merely undecided. That is plausible for validation errors and unresponsive buttons. It is doubtful for hesitation, where a long pause may equally mean a search for a card, an interruption, or second thoughts about the purchase. Whether mined patterns identify interface problems more quickly or more completely than expert review and ordinary funnel analysis is an empirical question.
Several technical uncertainties also need study. Results may be sensitive to the alphabet, the support threshold and the gap constraint, and an honest application would report how the pattern list changes as these vary. Mobile checkouts that hand off to a wallet or banking application leave a gap in the record exactly where payment happens. Sampling of sessions by the replay tool, common for reasons of cost, may under-represent rare but severe failures. And the confirmation experiments require enough traffic to detect modest changes in completion, which smaller retailers may lack. Until such questions are examined on real storefront data, the friction index should be treated as an aid to investigation.
7. Conclusion
Funnel reports show where checkouts are abandoned and session replays show how, one session at a time. The procedure proposed in this article connects the two by encoding replay events as sequences, mining the patterns that distinguish abandoned from completed attempts, summarising them in a transition model and an index, and confirming candidates by review and experiment before any conclusion is drawn. Its ingredients are standard and their combination is untested. Applied with care for privacy and for the difference between association and cause, it offers a structured way to decide which parts of a checkout deserve a designer's attention first.
Conflict of interest
To be declared by the author(s) before publication.
Funding
To be declared by the author(s) before publication.