1. Introduction
In federated learning a server sends the current model to a set of client devices, each client improves it using data held locally, and the server averages the returned updates into a new model. The federated averaging algorithm that established the approach was motivated by mobile phones, whose data are both valuable for learning and too sensitive or too bulky to upload (McMahan et al., 2017). Production systems followed, among them next-word prediction for a mobile keyboard (Hard et al., 2018), and the design of a large deployment has been described in detail by Bonawitz et al. (2019).
The privacy argument for the method is made at the level of the system. The cost is paid by the individual handset. Training a neural network is far heavier than running one, and a device that takes part in a round spends processor time, draws down its battery, warms up, and moves the model across its network connection twice. Survey papers list systems heterogeneity and communication cost among the central challenges of the field (Li et al., 2020; Kairouz et al., 2021). Yet the evidence on how large these costs are on actual phones is thin, because research prototypes are mostly evaluated in simulation on servers, with device behaviour represented by assumed speeds or by traces.
This article sets out a procedure for measuring the overhead directly on a testbed of dissimilar smartphones. It is addressed to researchers who propose federated algorithms and wish to state their device-side cost, and to engineers deciding whether a workload is acceptable on the phones their users own. The procedure is a proposal drawn from the literature on federated systems and on smartphone power and performance measurement. No measurements are reported, and the procedure has not been validated here.
2. Background
The procedure rests on three observations from prior work, concerning the diversity of phones, the tools available for running federated workloads on them, and the difficulty of measuring energy on a handset.
2.1. Why heterogeneity cannot be averaged away
Benchmarking of neural network inference across Android devices has shown very large differences in speed between chipsets and between the software paths, processor, graphics unit or dedicated accelerator, that a framework may take on the same chipset (Ignatov et al., 2018). Training widens the gap, since it is usually confined to the processor and stresses memory. Yang et al. (2021) examined federated learning with data and state traces from a large population of smartphones and concluded that heterogeneity in hardware and in device availability degrades both the accuracy and the speed of training relative to what homogeneous simulations predict. Client selection schemes exist precisely because some devices cannot finish a round in time (Nishio and Yonetani, 2019), and such schemes need per-device cost figures as input.
2.2. Frameworks and benchmarks
Several open tools make a phone testbed practical. Flower separates the federated protocol from the training code and supports clients on mobile operating systems (Beutel et al., 2020). LEAF provides datasets partitioned by the user who generated them, which gives each client a realistic and unequal share of data (Caldas et al., 2018). FedScale couples datasets with device capability and availability traces for evaluation at scale (Lai et al., 2022). These projects report system metrics mostly from emulated clients, and measurements on physical devices can supply the profiles that their simulations assume.
2.3. Measuring energy on a phone
Smartphone energy accounting has a literature of its own. Carroll and Heiser (2010) instrumented the power rails of a handset to attribute consumption to components. Pathak et al. (2012) showed that energy cannot be attributed simply by utilisation, because components such as radios remain in a high-power state for some time after an operation ends. For cellular links this tail was characterised by Huang et al. (2012), who found that the radio lingers in its active state after a transfer and that the energy of a short exchange is dominated by the tail and not by the bytes sent. Two practical consequences follow for the present purpose. Communication energy is not proportional to update size, and any measurement window must extend beyond the end of the transfer.
3. The Proposed Procedure
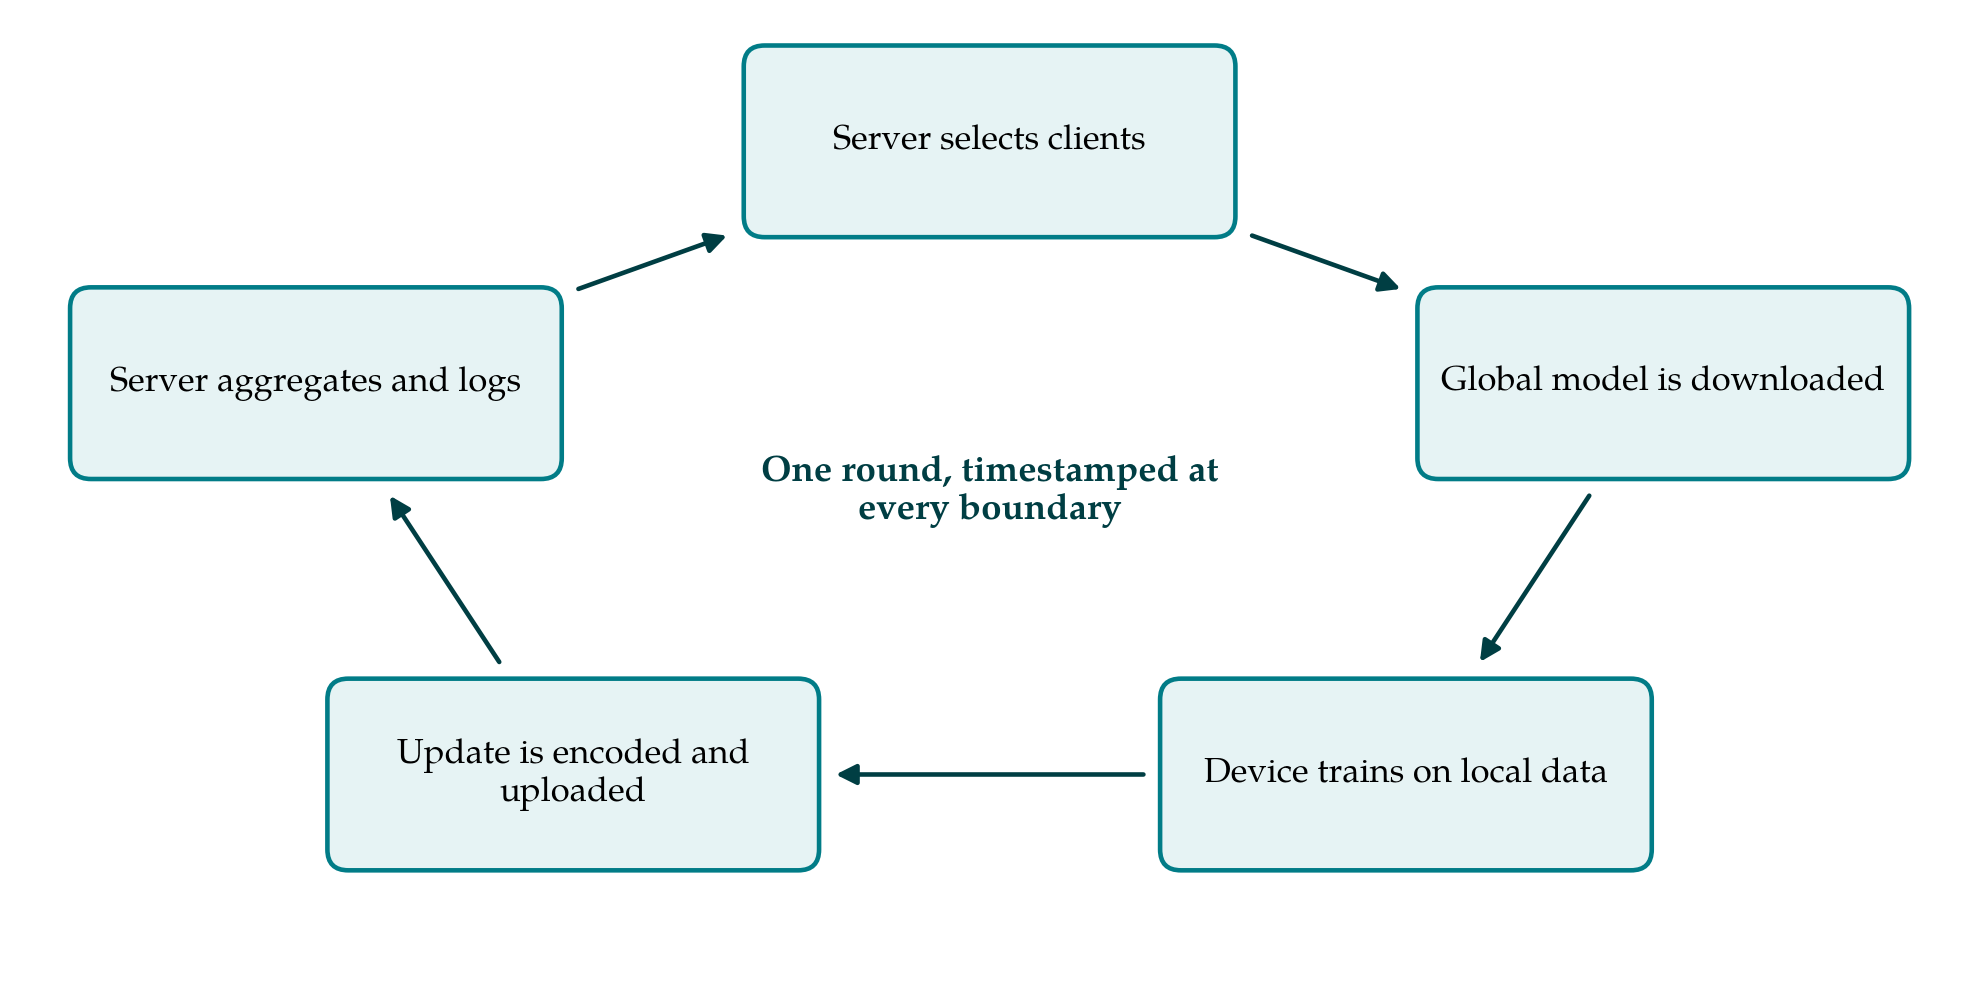
The procedure comprises eight steps. They are described below in order. Figure 1 shows the round whose phases are to be measured, and Table 1, placed with Step 4, lists the quantities recorded.
| Quantity | How it is obtained | Reported as |
|---|---|---|
| Phase durations | Monotonic timestamps at phase boundaries in the client | Seconds per phase; spread over repetitions |
| Energy | External power monitor on reference units; fuel gauge on all units | Joules above idle baseline, per phase |
| Network traffic | Socket counters in the client and interface counters | Bytes up and down, including protocol overhead |
| Peak memory | Process memory statistics sampled during training | Megabytes; failures from memory pressure |
| Thermal state | System temperature sensors and core frequencies | Temperature rise; time spent throttled |
| Completion | Server log of updates received before the deadline | Share of rounds completed per device |
3.1. Step 1: State the question and define overhead
Overhead is defined here as the resources a device consumes in one round in excess of what it would have consumed over the same interval had it not taken part. The resources are time, energy, peak memory, network bytes and temperature rise. A round is divided into four phases: receiving the model, training, sending the update, and waiting for the next instruction. The experimenter states at the outset which comparison the measurements are to support, for example two algorithms on the same devices, one algorithm across device tiers, or the effect of update compression. That statement determines which factors are varied and which are held fixed (Jain, 1991).
3.2. Step 2: Assemble a stratified device panel
Devices are chosen to span the population of interest and not for convenience. Strata are defined by chipset tier, from entry-level to flagship, by memory size, by operating system version and by age. At least two units of each model are included where possible, since units of the same model differ in battery wear and that affects both capacity and thermal behaviour. For every unit the experimenter records the model, chipset, memory, operating system build, battery health as reported by the system, and the vendor's power management settings, because manufacturers apply their own restrictions to background work. Older and cheaper phones are the part of the panel most likely to change the conclusions.
3.3. Step 3: Fix the workload
The model architecture, the dataset and its partition across clients, the number of local epochs, batch size, optimiser and numeric precision are fixed and published. A partition by natural user, as in LEAF, should be preferred to an equal split, because the amount of local data drives training time and differs greatly among real users (Caldas et al., 2018). The on-device training library and its version are recorded, together with the number of threads and whether an accelerator is used. If the study concerns an added mechanism, such as update compression (Konečný et al., 2016) or secure aggregation, whose cost grows with the number of participants (Bonawitz et al., 2017), the plain protocol is run as a reference under otherwise identical settings.
3.4. Step 4: Instrument the devices
The client application writes a timestamp at every phase boundary, using the monotonic clock, and logs peak memory, bytes sent and received on its sockets, processor frequency per core and the temperatures exposed by the system. Energy is measured in two ways. On a subset of devices, one per stratum, an external power monitor supplies the phone in place of its battery and samples current at a high rate. This is the reference measurement. On all devices the battery fuel gauge is read through the operating system. Fuel-gauge readings are coarse, are updated at intervals that vary by vendor, and may be averaged internally, so they are used only after the cross-check in Step 6. Logging is kept light and identical across devices.
3.5. Step 5: Control the environment
Phones react to their surroundings. Ambient temperature is kept within a narrow band and logged, and devices rest on the same surface without cases. Screens are off, other applications are closed, automatic updates and synchronisation are disabled, and each device is restored to the same state before a session. Charging state needs a deliberate choice. Production systems typically train only while a phone is idle, charging and on an unmetered network (Bonawitz et al., 2019), but a charging phone hides its consumption from the fuel gauge and is warmer. The procedure therefore measures on battery, within a fixed band of charge, and reports this departure from production conditions. Network conditions are set with a dedicated access point, and where cellular links matter, a real cellular connection is used in preference to a shaped Wi-Fi link, since shaping reproduces the data rate but not the radio's power states.
3.6. Step 6: Calibrate baselines
Before any training, each device is observed idle, with the client application installed and connected but inactive, for long enough to obtain a stable baseline power and temperature. A short standard computation, such as a fixed number of inference passes of the study model, is then run as a sanity check that the device performs as its stratum suggests. On the reference units the fuel-gauge readings are compared with the external monitor over idle and loaded intervals, and the discrepancy is recorded as the uncertainty to attach to fuel-gauge figures from the other units of that stratum. A device whose gauge cannot resolve the energy of a single round contributes timing, traffic and thermal data only.
3.7. Step 7: Run randomised, repeated rounds
A session consists of a fixed number of consecutive rounds per device. Two regimes are measured because they answer different questions. In the cold regime the device is allowed to return to its baseline temperature between rounds, which isolates the cost of a single participation. In the sustained regime rounds follow one another without pause until temperature and frequency stabilise, which exposes thermal throttling and shows what repeated selection would cost. The order in which configurations are run is randomised across devices and days so that drift in ambient conditions or network load is not confounded with the factor under study, and each configuration is repeated often enough to estimate its variability (Jain, 1991). Rounds that fail are logged with their cause and counted, not discarded.
3.8. Step 8: Analyse and report
For each device and configuration the analysis subtracts the idle baseline, integrates power over each phase with the measurement window extended to capture radio tails, and reports the distribution over repetitions, not a single mean. Results are presented per stratum before any pooling, with the ratio between the slowest and fastest strata stated explicitly. Energy is also expressed as a share of the nominal battery capacity, which is the form in which a product team will ask for it. The report gives the device panel, workload, software versions, conditions and raw logs, and keeps reference-monitor and fuel-gauge figures apart.
4. Fitting the Procedure to a Laboratory
The full procedure assumes an external power monitor and the skill to connect it in place of a battery, which on current sealed handsets means opening the case. A laboratory without that capability can still follow every step other than the reference energy measurement, and should then present energy as indicative. A panel of six to ten devices in three strata is enough to show whether heterogeneity matters for a given workload, though not to characterise a market. Automation repays its cost early: a controller that resets devices, starts sessions through the debugging interface over the network instead of a powered cable, and collects logs removes most of the handling errors that otherwise accumulate over days of runs.
5. Limitations and What Remains to Be Shown
The procedure is untested as a whole. Its individual elements are established practice in mobile systems research, but whether together they yield figures that two laboratories can reproduce on the same phone models has to be demonstrated, ideally by an inter-laboratory comparison on a shared workload. The adequacy of fuel-gauge readings after calibration is uncertain and will vary by vendor. A testbed also omits what makes field conditions hard: users who pick up the phone in the middle of a round, weak or changing signal, and the operating system's own decisions to defer background work. Measurements on battery differ from the charging state in which production training usually runs. Finally, the procedure measures device cost only. Server-side cost, and the relation between per-round overhead and the number of rounds needed to reach a target accuracy, must be combined with it before any algorithm can be judged efficient.
6. Conclusion
Claims about the efficiency of federated learning on phones ought to rest on measurements from phones, taken across the range of devices that people actually carry. The eight-step procedure proposed here defines overhead against an idle baseline, divides it by phase, combines a reference power measurement with calibrated on-device readings, and controls the thermal, radio and background effects that most often distort such experiments. Its adoption would give algorithm designers a common way of stating device-side cost. Its validation, through application and comparison between laboratories, is the next step.
Conflict of interest
To be declared by the author(s) before publication.
Funding
To be declared by the author(s) before publication.