1. Introduction
A gearbox leaves the assembly line only after shafts and gears have been built into sub-assemblies, bearings pressed, preload or backlash set by measured shims, the housing sealed and closed, oil filled, and the finished unit tested for leaks and noise. Some of these operations are quick and repetitive. Others depend on measurement and selection, and one of them, the test, sends a proportion of units back for rework. The time between one good gearbox and the next is therefore set by the interaction of stations and not by any one of them.
Lean production offers a way of looking at such a line as a whole. Its central idea is that only some of the time a product spends in the plant adds value for the customer, and that the rest should be exposed and removed (Ohno, 1988; Womack and Jones, 1996). Value stream mapping, set out as a practical method by Rother and Shook (1999), is the tool most widely used for the purpose. It records the flow of material and information for one product family on a single sheet and uses that picture to design an improved flow.
This article adapts the method to a gearbox assembly line with cycle time as the target. It is written as a guide. The procedure is proposed on the basis of the literature and has not been applied or tested here, so it reports no before-and-after figures. What it offers is a sequence of stages, the data each requires, and the points at which gearbox assembly departs from the textbook examples.
2. Terms and Background
Three time measures are easily confused, and the procedure depends on keeping them apart. Cycle time is used here in the sense of Rother and Shook (1999): the interval at which a process completes one unit, as timed by observation. Takt time is the available working time in a period divided by the customer demand in that period, and it states the interval at which the line must complete units to meet demand. Lead time is the time one unit takes to travel the whole stream, including the time it waits in inventory. A line whose cycle time exceeds takt cannot meet demand without overtime. A line whose cycle time is well below takt overproduces or idles.
The mapping literature is extensive. Hines and Rich (1997) described a family of mapping tools matched to the classical seven wastes. Later evaluations found the Rother and Shook method effective for redesigning manufacturing systems while pointing to the effort and training it requires (Lasa et al., 2008; Serrano et al., 2008). Braglia et al. (2006) addressed its main structural weakness, that it follows a single linear flow, and proposed an extension for products whose components converge from several branches. That weakness is relevant here, since a gearbox is exactly such a product.
3. The Proposed Procedure
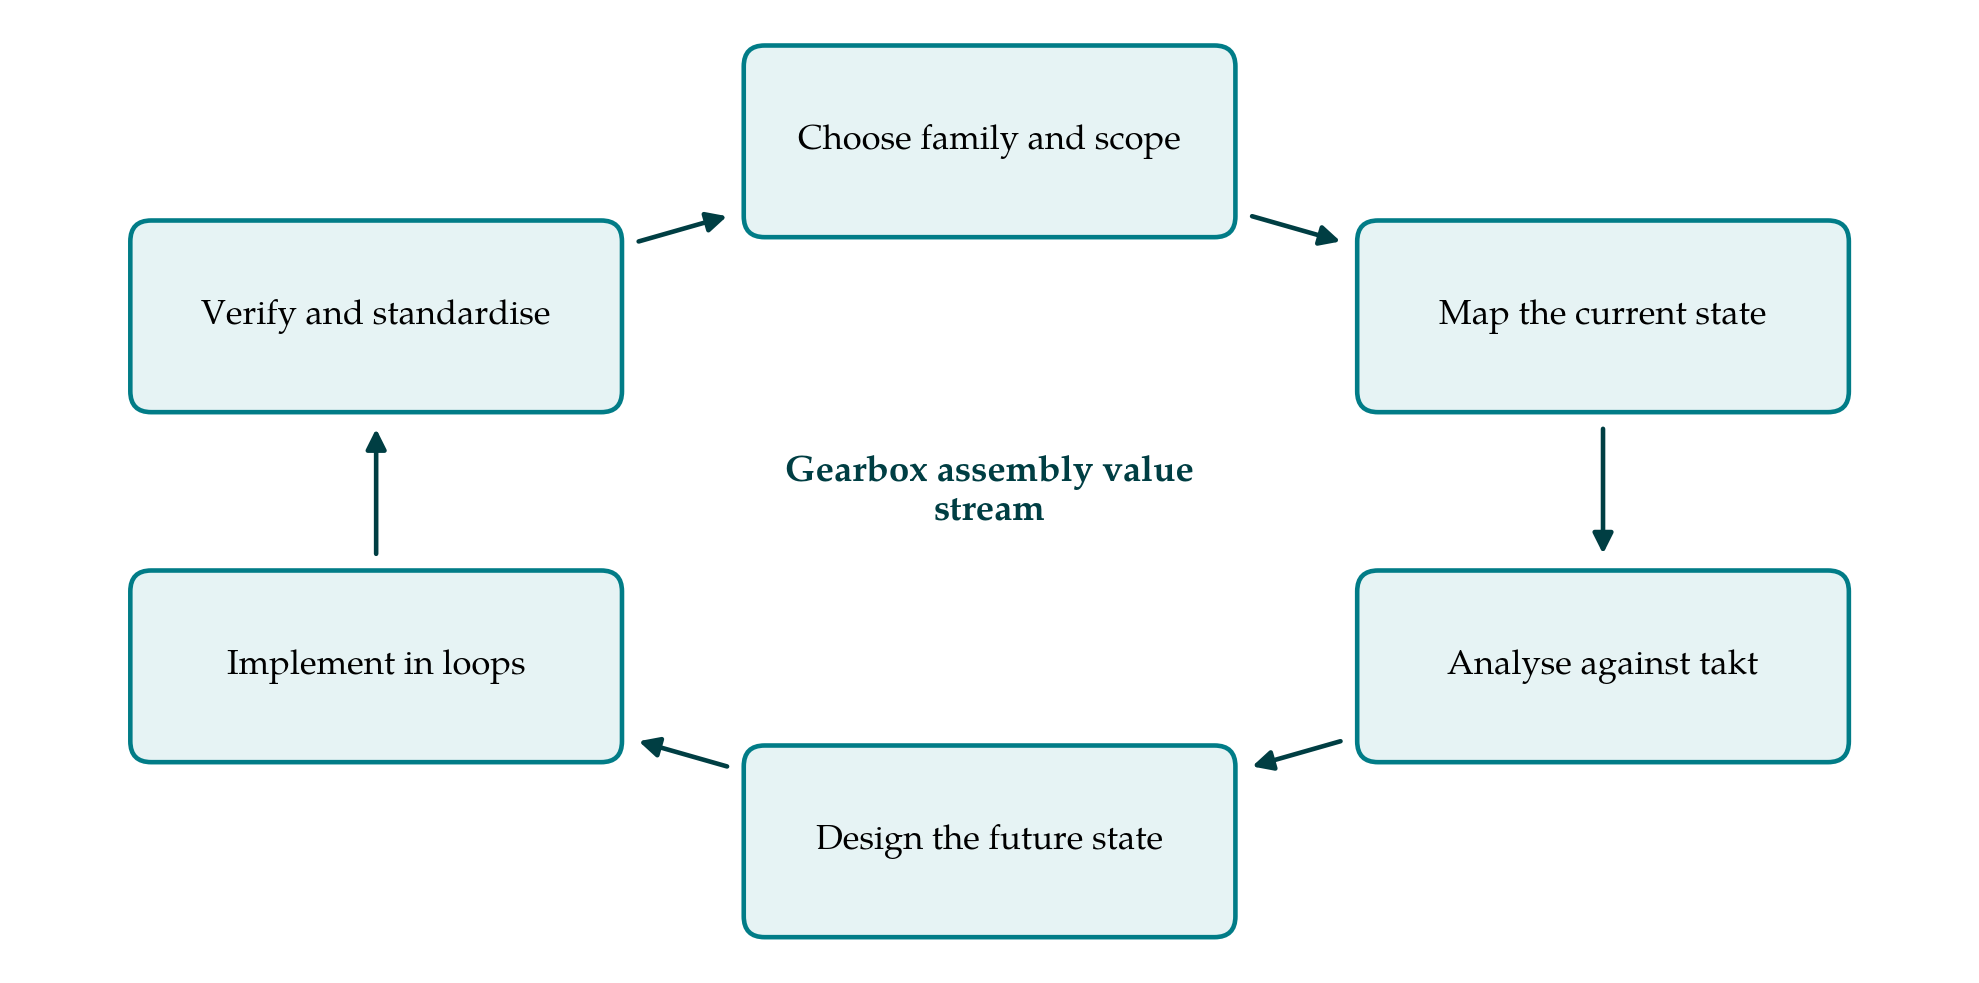
The procedure follows the logic of the standard method and adds what assembly of a geared unit requires. Figure 1 shows its six stages as a cycle, because a future state, once reached, becomes the current state for the next round.
3.1. Stage 1: Choose the product family and the scope
A line usually builds several variants that differ in ratio, housing or input arrangement. The map should follow one family, defined as the variants that pass through the same sequence of stations with similar work content. A product and process matrix, with variants as rows and stations as columns, makes the grouping visible. The scope should run from the point at which kitted or line-side components are presented to the first station, to the dispatch area after final test. Machining of gears and housings belongs to a separate map, although its delivery pattern enters this one as the supplier. A small team should be named: the line supervisor, an operator, a quality engineer and someone from planning, led by a person with authority to make changes.
3.2. Stage 2: Map the current state
The current state is drawn by walking the line, starting at dispatch and working upstream so that the map follows the pull of the customer. Each station or group of stations with continuous flow becomes a process box. Between boxes, the units waiting are counted and drawn as inventory. Table 1 lists the data to be recorded in each box and how each should be obtained. The rule that matters most is that figures are taken on the floor, with a stopwatch and a count, and not copied from routing sheets or the planning system, whose standard times describe an intended method that may no longer be the one in use (Rother and Shook, 1999).
| Data item | Definition | How to obtain it |
|---|---|---|
| Cycle time | Interval between successive completed units at the station | Time ten or more consecutive cycles; note the range |
| Operator work content | Manual time per unit, separated from machine time | Time study by work element |
| Changeover time | Last good unit of one variant to first good unit of the next | Observe a real variant change |
| Uptime | Share of scheduled time the station can run | Stoppage log kept over several shifts |
| First-pass yield | Share of units passing without rework or adjustment | Count at the station and at final test |
| Inventory | Units waiting before the station, including rework | Physical count during the walk |
| Information trigger | What tells the station which variant to build next | Ask the operator; follow the paper or signal |
Timing should follow established work measurement practice: the job is divided into elements, several cycles are timed, and delays are recorded separately so that they are not hidden in an average (Freivalds and Niebel, 2013). Gearbox assembly needs three additions to the standard box. Where shims are selected by measurement, the number of trial fits per unit should be recorded, since a second or third fit multiplies the station time. The rework loop from the end-of-line test should be drawn as a flow of its own, with its inventory and its time. And the sub-assembly branches for shafts and differential or planetary sets should each be mapped back to their start, following the approach of Braglia et al. (2006), so that the branch that paces the main line can be identified.
The map is completed with the information flow, showing how customer orders become a build sequence and how each station learns of it, and with a timeline along the foot of the sheet that sets the sum of the processing times against the total lead time. Inventory is converted to time by dividing each count by the daily demand.
3.3. Stage 3: Analyse the current state against takt
Takt time is calculated from the demand for the family and the working time available after planned breaks. Each station's cycle time is then set beside it on an operator balance chart. Stations above takt are the immediate constraints. Stations far below it hold spare capacity that may be combined. The search for the true constraint should take account of uptime and yield, since a station with an acceptable cycle time and frequent stoppages may limit output more than a slow and steady one. This is the reasoning of constraint management (Goldratt and Cox, 1984), and Hopp and Spearman (2008) show formally how variability in process times and outages lengthens queues and cycle times even when average capacity appears sufficient.
The analysis then asks, for each element of work, whether it adds value, is necessary without adding value, or is waste in the sense of Ohno (1988). In assembly the common findings are walking to fetch parts, searching for the right shim or seal, waiting for a press or a test stand, handling units into and out of buffers, and repeating work after a failed test. Each should be marked on the map where it occurs, with its time.
3.4. Stage 4: Design the future state
The future state is designed by answering in order the questions that Rother and Shook (1999) pose: what the takt time is, where continuous flow is possible, where supermarkets and pull signals are needed because it is not, which single process should be scheduled as the pacemaker, how the variant mix will be levelled there, and what improvements to individual processes the design presupposes. For a gearbox line the pacemaker is normally the main assembly line, with sub-assembly branches replenishing small supermarkets by pull.
Within the main line, work elements are redistributed so that each operator's content is close to takt and no station exceeds it. This is the assembly line balancing problem, for which a large body of exact and heuristic methods exists (Scholl and Becker, 2006; Boysen et al., 2007); for a manual line of modest length a balance chart and the guidance of Rother and Harris (2001) on cell design are usually sufficient. Process improvements should be aimed at the causes found in Stage 3. Typical candidates are kitting or sequenced line-side presentation to remove walking and searching, error-proofing devices that prevent a wrong bearing or a missing circlip from reaching the test stand (Shingo, 1986), quicker changeover of press tooling between variants, and gauging that gives the correct shim at the first fit.
3.5. Stage 5: Implement in loops
A future state map is a design and not yet a plan. It should be divided into loops, each a segment of the stream that can be changed and stabilised on its own: the pacemaker loop around main assembly and test, a loop for each sub-assembly branch, and a supplier loop for incoming components. For each loop the team sets a measurable target, a date and a responsible person. Work normally starts at the pacemaker, because improvements there determine what the upstream loops must supply.
3.6. Stage 6: Verify and standardise
After each loop is changed, the data of Table 1 are taken again by the same method, and the new cycle time is compared with takt over a period long enough to include variant changes and ordinary disturbances. Where the target is met, the method is written into standardised work: the sequence of elements, the takt time and the standard in-process stock (Monden, 1998). Where it is not, the team returns to the analysis. The revised map then becomes the current state for the next cycle.
4. Fitting the Procedure to Practice
Several conditions decide whether the procedure can be followed as written. Demand must be stable enough for a takt time to mean something; where it swings widely, takt should be set for a planning period and reviewed at each change. Operators must be told why they are being timed, and should take part in the timing, or the observed cycles will not be the normal ones. Quality requirements set limits that the map does not show: tightening sequences, cleanliness and test durations are fixed by the product specification and cannot be shortened by a line team. Changes to these belong to product and process engineering, and ideally to design for assembly at the next model change (Boothroyd et al., 2011).
Management attention is the remaining condition. Accounts of the Toyota system insist that its tools work as part of a way of managing and not as isolated techniques (Liker, 2004). A map drawn by a specialist and filed will change nothing on the line.
5. Limitations and What Remains to Be Shown
The procedure is a proposal and has not been applied or validated here. Its usefulness on a real gearbox line would have to be shown by applying it and reporting, with the measurement method stated, cycle time against takt, lead time, first-pass yield and output before and after, over a period long enough to exclude a temporary effect of attention. A comparison with a line improved by other means would be more convincing still.
The method also has known limits. A value stream map is a static picture taken on particular days and represents variability poorly, which is a serious matter on a line with a rework loop. Where the future state depends on how buffers and test capacity behave under variation, discrete-event simulation of the candidate designs is a sensible complement, as Abdulmalek and Rajgopal (2007) demonstrated in a process industry setting. The map follows one family and may improve it at the expense of others that share the line. And it measures time, not cost or ergonomics, both of which must be checked before a rebalanced line is adopted.
6. Conclusion
Value stream mapping gives a gearbox assembly team a disciplined way to see where the interval between finished units is being lost and to design a line paced by demand. The six stages proposed here keep to the established method and add the features that geared assemblies call for: converging sub-assembly branches, measured adjustment operations and a rework loop from final test. The guide leaves the size of the gain unstated, because that can only be established on a line. Its claim is narrower: that a team following these stages will know its takt time, its real cycle times and its constraint, and will have a reasoned design to work towards.
Conflict of interest
To be declared by the author(s) before publication.
Funding
To be declared by the author(s) before publication.