1. Introduction
The vibration of footbridges is usually discussed in terms of people. The lateral sway of the London Millennium Footbridge on its opening day, analysed by Dallard et al. (2001), made pedestrian-induced motion a standard design check, and guidance such as that of Sétra (2006) is organised around walking frequencies and comfort. The same properties that make a footbridge lively under foot, low mass, low natural frequencies and damping that is often below one per cent of critical, also make it responsive to wind. A slender deck is a bluff body in a cross-flow, and the family of flow-induced vibrations catalogued by Blevins (1990) applies to it in full.
In regions exposed to tropical cyclones, known regionally as hurricanes or typhoons, the governing wind event is transient. Nobody is on the bridge at the height of the storm, so comfort is irrelevant and the questions become structural: whether the deck remains aerodynamically stable, what amplitudes and stresses it reaches, and how much fatigue damage accumulates in hangers, bearings and connections during hours of strong wind. The engineer needs a way to work through those questions in order.
This article proposes such a framework. It was prompted by the observation that the relevant knowledge is spread across tropical meteorology, bluff-body aerodynamics and bridge dynamics, and is seldom brought together at the scale of a footbridge. The framework is offered as a method. It is not a report on any particular bridge or storm, and it has not been validated here.
2. Background
Two bodies of knowledge underlie the framework: the mechanisms by which wind excites a bridge deck, and the ways in which cyclone winds differ from the winds assumed in codes.
2.1. Mechanisms of wind-induced deck vibration
Four mechanisms are distinguished in bridge aerodynamics (Simiu and Scanlan, 1996). Vortex-induced vibration arises when the frequency of vortex shedding from the deck, proportional to wind speed through the Strouhal number, coincides with a natural frequency; the motion then organises the shedding and the two lock together over a range of speeds (Williamson and Govardhan, 2004). Amplitudes are self-limiting, and are governed by the product of mass and damping expressed as the Scruton number. Galloping is a single-degree-of-freedom instability of sections whose lift falls with increasing angle of attack, by the criterion that Den Hartog derived for iced conductors (Blevins, 1990). Flutter is a self-excited instability in which motion-dependent forces feed energy into torsion, or into coupled torsion and bending, above a critical speed. Scanlan and Tomko (1971) cast those forces in terms of flutter derivatives measured on section models, and Billah and Scanlan (1991) explained why the Tacoma Narrows collapse belongs in this category and not under resonance. Buffeting, finally, is the forced random response to turbulence, treated statistically since the work of Davenport (1962). Table 1 summarises the four.
| Mechanism | Governing quantity | Screening check | Typical mitigation |
|---|---|---|---|
| Vortex-induced vibration | Strouhal number; Scruton number | Critical speed for each mode against speeds reached in the storm | Added damping; guide vanes or fairings |
| Galloping | Slope of lift with angle of attack | Den Hartog criterion over the range of wind incidence | Change of section shape; damping |
| Flutter | Flutter derivatives; frequency ratio | Critical speed with a margin above the design wind speed | Streamlining; torsional stiffness |
| Buffeting | Turbulence spectrum; aerodynamic admittance | Stresses and fatigue over the storm duration | Stiffness; damping; robust detailing |
| Parapet and cable vibration | Local shedding and wake effects | Local natural frequencies against shedding bands | Local stiffening; small dampers |
2.2. How cyclone winds differ
Codes of practice such as Eurocode 1 (CEN, 2005) describe wind as a stationary process with a mean profile, a turbulence intensity and a spectrum appropriate to large-scale storms. A tropical cyclone departs from that description in ways that matter for a flexible structure (Holmes, 2015). The wind field is organised around the eye: speed rises toward the radius of maximum winds, as in the profile of Holland (1980), and collapses inside it. A site near the track sees the wind climb over several hours, perhaps fall as the eye passes, and return from a different direction. The record is therefore non-stationary, with a mean that varies in time. Turbulence intensities near the eyewall are often reported to exceed those of ordinary strong winds over the same terrain, and the surface drag over water behaves differently at extreme speeds (Powell et al., 2003). Design speeds for such regions are obtained by simulating many synthetic storms from the statistics of historical tracks (Vickery et al., 2000).
3. The Proposed Framework
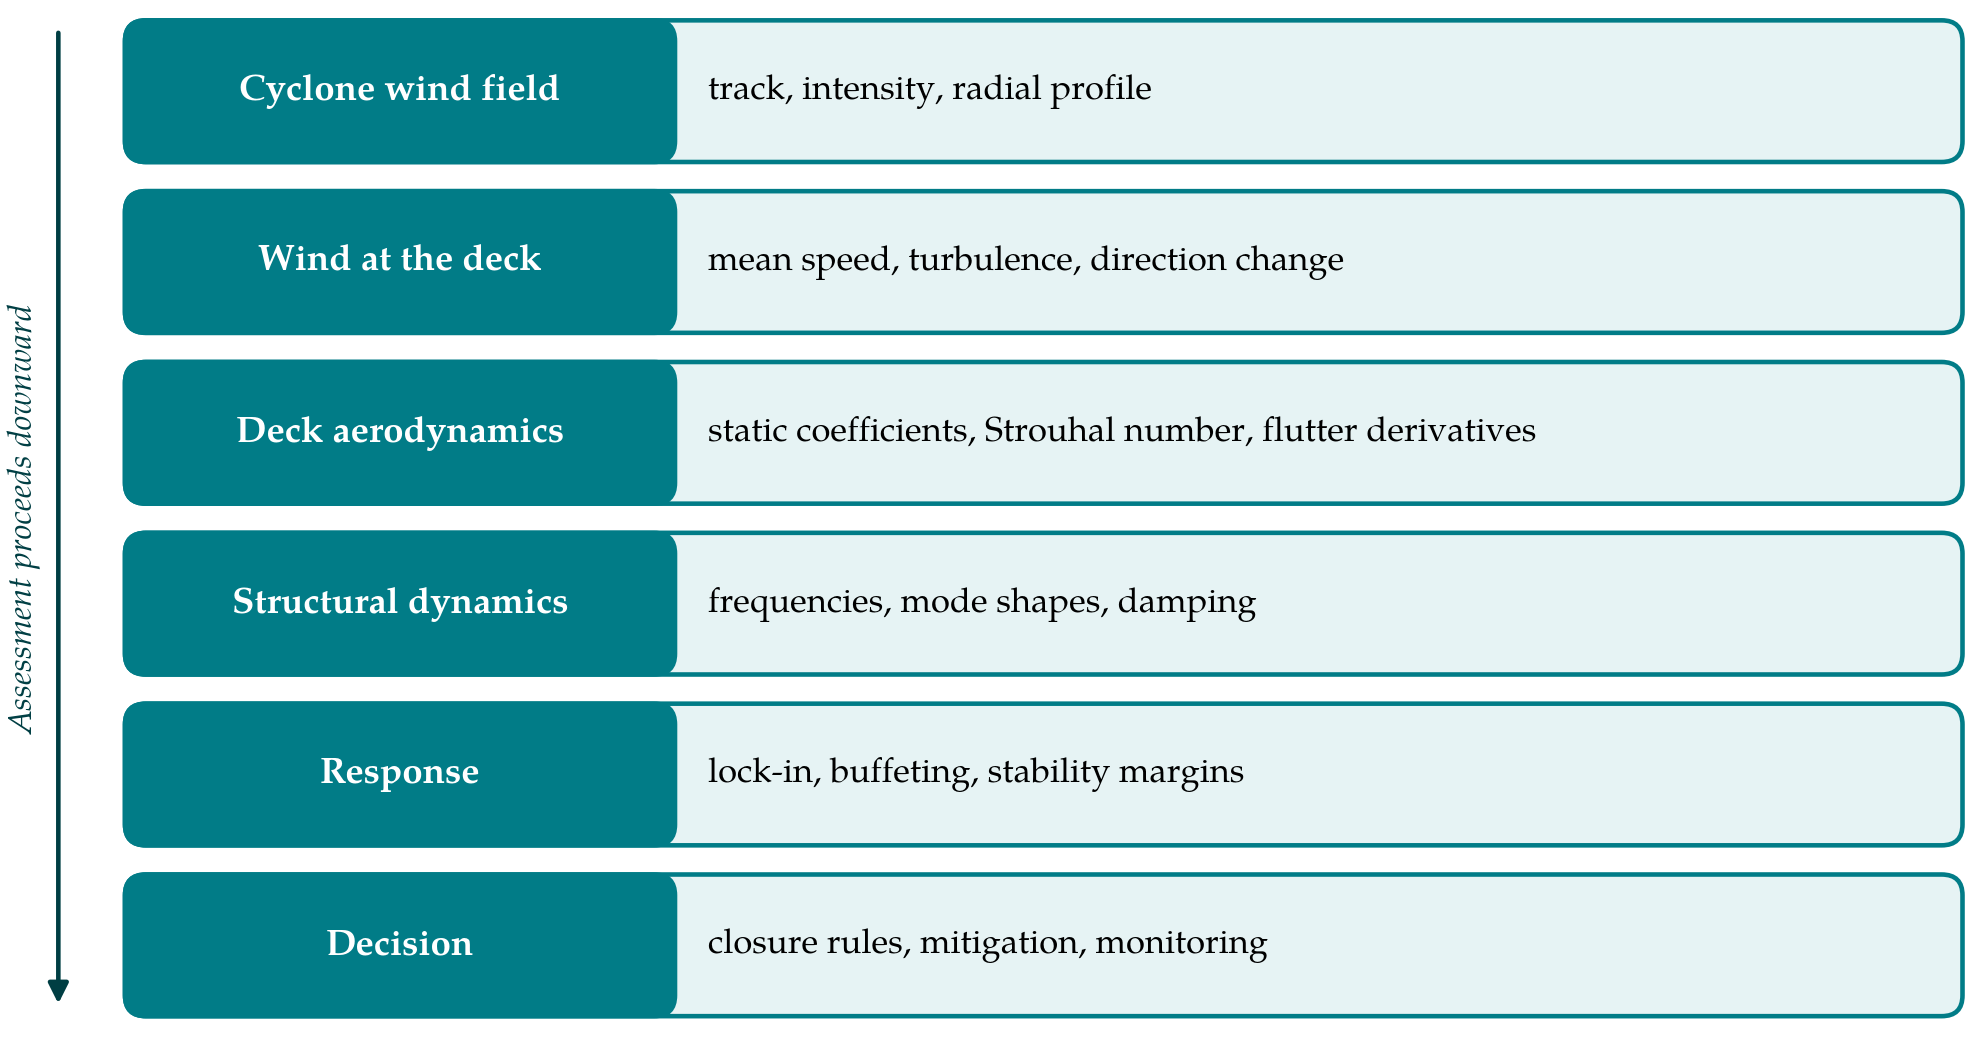
The framework proceeds through six stages, each supplying the input for the next. Figure 1 shows them as layers from the storm down to the engineering decision.
3.1. Stage 1: Describe the cyclone wind field
The assessment begins with a small set of scenario storms and not a single design speed. Each scenario is defined by track relative to the site, central pressure deficit, radius of maximum winds and forward speed, drawn from the regional climatology or from the simulation methods cited above. A parametric wind-field model then yields the gradient-level speed and direction at the site as functions of time. Scenarios should include a direct passage of the eyewall and at least one oblique passage, because the sequence of directions differs between them.
3.2. Stage 2: Translate the wind to the deck
Gradient winds are brought down to deck height using a boundary-layer model suited to the upstream terrain, which for many footbridges means a short over-water fetch, a river valley or an urban canyon. The output is a time history of mean speed and direction at the deck together with turbulence intensities and length scales, the latter taken from a standard spectrum such as that of Kaimal et al. (1972) unless site measurements justify another. Local topography can channel the flow along a valley whatever the gradient direction, and this should be checked, since the component normal to the deck is what excites it. The angle of the wind in the vertical plane also deserves attention near embankments and escarpments.
3.3. Stage 3: Characterise the deck aerodynamics
The section is characterised by its static force and moment coefficients over a range of angles of attack, its Strouhal number and, where flutter cannot be excluded by inspection, its flutter derivatives. For common shapes preliminary values can be taken from the literature (Holmes, 2015). Footbridge sections are seldom common, however. Solid parapets, mesh infill, handrails and service ducts change the shedding behaviour markedly, and a section-model test in a wind tunnel remains the reliable source. Computational simulation is a useful complement for comparing alternative details, provided it is checked against the tunnel for at least one configuration.
3.4. Stage 4: Establish the structural dynamics
Natural frequencies, mode shapes and modal masses come from a finite element model. Damping cannot be computed and is the most uncertain input to the whole assessment. For an existing bridge it should be measured, most conveniently by output-only identification from ambient vibration records using frequency-domain decomposition (Brincker et al., 2001) or stochastic subspace identification (Peeters and De Roeck, 1999). For a new design a cautious value is assumed and the sensitivity of every later result to it is reported. Vertical bending, lateral bending and torsional modes are all retained, with their frequency ratios noted for the flutter check.
3.5. Stage 5: Predict the response by mechanism
Each mechanism in Table 1 is examined against the time history from Stage 2. For vortex-induced vibration the critical speed of every mode is computed from the Strouhal relation and compared with the speeds through which the storm passes. A cyclone crosses the lock-in range twice, on the rise and on the decay, and the time spent there determines the number of cycles; amplitude is estimated from the Scruton number using an empirical model of the kind collected by Simiu and Scanlan (1996). Galloping and flutter are treated as limits: the critical speeds must exceed the peak deck-level speed of the severest scenario by a stated margin, across the range of incidence found in Stage 2.
Buffeting needs the most care because the usual spectral method presumes stationarity. Two options are available. The storm can be divided into intervals short enough for the mean to be treated as constant and analysed interval by interval in the frequency domain. Alternatively the response can be computed in the time domain with self-excited and buffeting forces applied together, following formulations such as that of Chen et al. (2000), using simulated turbulence whose intensity follows the slowly varying mean. Either route gives stress histories from which peak values and fatigue damage over the storm are obtained.
Fatigue is assessed from those histories and not from peak response. Stress ranges at hangers, stay anchorages, welded connections and bearings are counted by the rainflow method and summed with a linear damage rule against the detail categories of the governing steel or concrete code. Two features of a cyclone make this step more than a formality. The storm lasts for hours, so a lightly damped mode accumulates a large number of cycles, and lock-in episodes contribute narrow-band cycles of nearly constant amplitude that are more damaging than broadband buffeting of the same peak. The damage from one scenario storm should be set beside the damage budget assumed for the whole service life.
3.6. Stage 6: Decide on mitigation and monitoring
The predicted responses are set against structural limits: member and connection stresses, bearing and expansion-joint movements, hanger or stay fatigue, and stability margins. Where a limit is approached the remedies are those listed in Table 1. Aerodynamic changes are often cheapest when made early, and the guide vanes fitted to the Storebælt suspension bridge to suppress vortex-induced oscillation are a well-documented precedent on a far larger deck (Larsen et al., 2000). Tuned mass dampers, already familiar on footbridges for pedestrian loading, serve against lock-in if tuned to the mode concerned. The framework also asks for an operational output, namely the wind speed at which the bridge is closed, and for a modest monitoring installation, an anemometer at deck level and a few accelerometers, so that predictions can be compared with behaviour when a storm does arrive.
4. Fitting the Framework to Practice
The effort should be proportionate. For a short, stiff footbridge whose lowest frequencies place every critical speed far above the cyclone peak, Stages 3 to 5 reduce to a screening calculation with literature coefficients. The full sequence, with tunnel tests and time-domain analysis, is warranted for long spans, cable-supported decks, unusual sections and sites of high exposure. A tiered application of this kind mirrors the way existing guidance grades footbridges for pedestrian dynamics, and it keeps the cost of assessment in line with the consequence of getting it wrong.
Whatever the tier, the assessment should leave a short record: the scenarios considered, the source of every aerodynamic coefficient, the damping assumed or measured, the critical speed of each mechanism for each mode, and the margin to the peak deck-level wind. Uncertainty is best conveyed by repeating the calculation with damping halved and with the Strouhal number varied over a plausible range, since those two inputs move the vortex-induced results most. A reviewer can then see at a glance which conclusion rests on measurement and which on assumption.
5. Limitations and What Remains to Be Shown
The framework is untested. Its stages rest on established methods, but their combination for a footbridge in a cyclone has not been demonstrated here, and several links are weak. Turbulence characteristics close to the eyewall at the low heights of footbridge decks are poorly documented. The behaviour of vortex-induced vibration in highly turbulent, accelerating flow is less certain than in the smooth flow of most laboratory work. Aerodynamic data for realistic footbridge sections with their furniture are scarce. A first application should therefore be made to an instrumented bridge, and should show whether the lock-in episodes and buffeting levels predicted for a recorded storm match those measured. Until that has been done the framework should be read as a structured checklist and its numerical outputs treated with corresponding caution.
6. Conclusion
A footbridge in a cyclone region faces a wind event that is strong, turbulent and changing, and its deck can respond through several distinct mechanisms in the course of one storm. The framework proposed here orders the assessment from the storm to the structure in six stages, makes the non-stationary character of the wind explicit, and ends with decisions an owner can act on: mitigation, closure rules and monitoring. Its value will be established only when it has been applied to a monitored bridge and its predictions compared with what the structure did.
Conflict of interest
To be declared by the author(s) before publication.
Funding
To be declared by the author(s) before publication.