1. Introduction
An end mill that begins to chatter announces it with a sharp change of sound and leaves a pattern of marks on the wall or floor of the cut. By then the part may be scrap and the cutter damaged. Operators learn to hear the onset and to back off the depth of cut or change the speed, but in an unattended cell or behind a full enclosure there is nobody listening. Chatter remains one of the principal limits on metal removal rate, and the literature on predicting, detecting and suppressing it is large (Quintana and Ciurana, 2011; Munoa et al., 2016).
Prediction by stability lobe diagrams requires the frequency response of the tool, holder and spindle and the cutting force coefficients of the work material. Small shops rarely have the equipment to measure either, and the response changes with every tool and stick-out. Detection during the cut asks for less: a sensor, a way of recording its signal, and a rule for telling chatter from the vibration that every interrupted cut produces. This article describes how such a detector can be assembled from inexpensive parts. It is a proposed procedure and reports no trial of it. The aim is to give a builder the reasoning needed to make sound choices and to recognise the limits of the result.
2. Background
The design rests on two bodies of knowledge: the mechanism of chatter, which determines what the signal looks like, and the experience of earlier detection systems, which shows which sensors and indicators have worked.
2.1. Regenerative chatter and its signature
Chatter in milling is predominantly regenerative. Each tooth cuts a surface left wavy by the tooth before it, the chip thickness varies with the phase between the two waves, and under unfavourable conditions the variation feeds a growing vibration. The mechanism was identified in the 1950s and 1960s (Tobias and Fishwick, 1958; Tlusty and Polacek, 1963), and the stability boundary for milling was put in a compact analytical form by Altintas and Budak (1995). Two consequences matter for detection. In a stable cut the vibration consists of the tooth passing frequency, the spindle rotation frequency and their harmonics. When chatter develops, a new component appears close to a natural frequency of the most flexible part of the system, and this frequency is in general not a harmonic of the spindle speed (Altintas and Weck, 2004).
Detection therefore amounts to finding energy at frequencies that are not synchronous with the spindle. One exception should be kept in mind. At low radial immersion a second kind of instability occurs in which the vibration repeats every second tooth period, and its spectral lines fall midway between the tooth passing harmonics (Altintas et al., 2008). A detector that only looks for a single peak near a natural frequency may miss it.
2.2. Earlier detection systems
Force, acceleration, sound and motor current have all been used as the sensed quantity. Delio et al. (1992) argued that a microphone compares well with other sensors for chatter detection and built a control scheme on its signal. Kuljanic et al. (2008) compared several sensors in milling and concluded that combining signals makes detection more robust than relying on one. The survey of machining monitoring by Teti et al. (2010) places these efforts in context. An indicator based on sampling the signal once per spindle revolution, so that synchronous vibration appears constant and chatter appears as scatter, was proposed by Schmitz (2003). The procedure below draws on all of these.
3. The Procedure
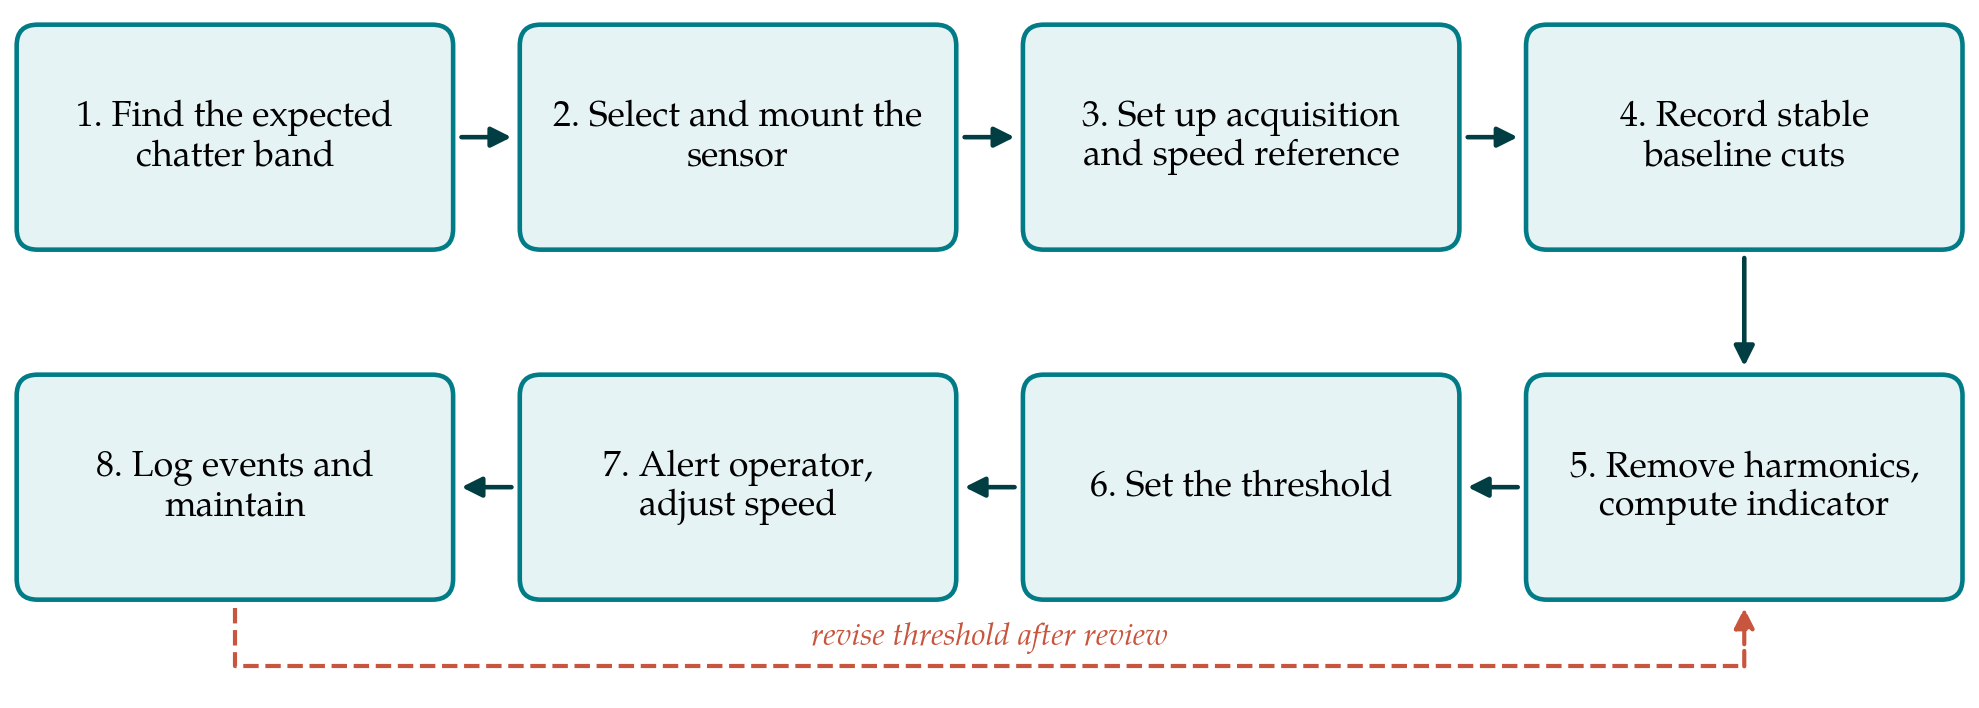
Figure 1 shows the eight steps in order. They are described in turn, with the choices a builder on a small budget is likely to face.
3.1. Step 1: Establish the expected chatter band
The sensor and sampling rate cannot be chosen until the builder knows roughly where chatter will appear. For the tools the machine normally carries, the dominant flexible modes of the tool, holder and spindle assembly should be located. The proper method is an impact test with an instrumented hammer (Ewins, 2000; Schmitz and Smith, 2009). Where no hammer is available, a workable substitute is to record the response of the stationary tool to a light tap with the sensor that will later be used, and read the ringing frequencies from its spectrum. Slender end mills in long holders have low first modes, while short, stiff tools ring considerably higher. The band to be monitored should cover the modes of every tool in regular use, with a margin on both sides.
3.2. Step 2: Select and mount the sensor
Table 1 compares the candidate sensors. For a low cost system the realistic choices are a micro-electromechanical accelerometer and a microphone. The accelerometer is preferred here because it is insensitive to shop noise and can be fixed permanently, but its datasheet must be checked against the band found in Step 1: many inexpensive devices have a usable bandwidth too narrow for stiff tools, and their noise floor is higher than that of piezoelectric sensors. The sensor should be mounted rigidly, by a stud or a thin layer of hard adhesive, on the spindle housing as near the front bearing as access allows, with its sensitive axis in the plane of the cut. Two axes are better than one, since the direction of the chatter mode is not known in advance.
| Sensor | Strengths | Limits |
|---|---|---|
| MEMS accelerometer | Cheap, small, digital output, easy to mount permanently | Limited bandwidth and higher noise; check the datasheet |
| Piezoelectric accelerometer | Wide bandwidth, low noise, established practice | Needs signal conditioning; costs many times more |
| Microphone | No contact, wide bandwidth, hears the workpiece too | Picks up shop noise; enclosure affects the signal |
| Spindle motor current | No added sensor on some controls | Drive bandwidth too low for most chatter frequencies |
| Force dynamometer | Direct measure of the cutting process | Laboratory instrument; cost and stiffness rule it out |
3.3. Step 3: Configure acquisition and a speed reference
The sampling theorem requires a rate of more than twice the highest frequency present (Shannon, 1949). In practice the rate should be at least two and a half times the top of the monitored band, and content above half the sampling rate must be removed before sampling, or it will fold back and appear as false peaks. Digital accelerometers usually include a filter for this purpose; an analogue sensor needs one added. A single-board computer or a microcontroller with a fast serial bus is adequate to read the sensor, provided samples are taken at even intervals by a hardware timer and not by a software loop. The spindle speed must also be known for each record. A once-per-revolution pulse from an optical or inductive pickup is the most dependable source and costs little.
3.4. Step 4: Record stable baseline cuts
Before any indicator is defined the system should record what normal looks like: the spindle running in air across its speed range, and a set of cuts known to be stable, taken at light depths with the usual tools and materials. These records show the spindle and tooth passing harmonics, any resonance of the sensor mounting, and electrical interference. They also give the distribution of the indicator in the absence of chatter, which Step 6 requires.
3.5. Step 5: Remove harmonics and compute an indicator
The signal is processed in short blocks, each long enough to resolve neighbouring harmonics and short enough to respond within a fraction of a second. Each block is multiplied by a window to limit leakage (Harris, 1978) and transformed to a spectrum. Averaging a few overlapping blocks in the manner of Welch (1967) steadies the estimate. Lines within a narrow tolerance of every multiple of the spindle frequency are then set aside, which removes the tooth passing harmonics and runout together. The indicator proposed is the ratio of the energy remaining in the monitored band to the total energy in that band. It is dimensionless, lies between zero and one, and is only weakly affected by the depth of cut in a stable cut, so that one threshold can serve many operations. The once-per-revolution scatter of Schmitz (2003) can be computed alongside it as a check.
3.6. Step 6: Set the threshold
The threshold is placed above the range of the indicator seen in the baseline cuts. It should then be confirmed against cuts taken deliberately into chatter on a sacrificial workpiece, by increasing the axial depth in small increments at a fixed speed until the sound and the surface marks leave no doubt. A persistence rule, requiring the indicator to exceed the threshold for several consecutive blocks, guards against alarms from entry and exit transients and from chips striking the housing.
3.7. Step 7: Connect the alert and a response rule
The simplest output is a lamp or sounder at the operator station, together with a display of the dominant non-synchronous frequency. That frequency is useful in itself. The established rule for escaping chatter by a speed change is to choose a spindle speed at which the tooth passing frequency equals the chatter frequency, or that frequency divided by a whole number, which places the cut in a pocket of higher stability (Delio et al., 1992; Schmitz and Smith, 2009). A low cost system should display the suggested speeds and leave the change to the operator. Writing to the machine control is a separate project with safety implications of its own.
3.8. Step 8: Log, review and maintain
Every alarm should be stored with its time, spindle speed, indicator value and spectrum. Reviewing the log against scrap and tool breakage records shows whether the threshold is set sensibly, and over time it maps the speeds at which each tool is troublesome. The sensor mounting should be inspected periodically, and the baseline repeated after a spindle repair or any change to the mounting.
4. Fitting the System to a Small Workshop
Three practical matters decide whether the system survives daily use. The sensor and its cable must withstand coolant, chips and cleaning; a sealed housing and a cable routed along existing conduit are worth more than a better sensor. The software should start with the machine and need no attention, because a detector that has to be launched by hand will be forgotten. The cost of parts is small compared with the hours spent on baseline and threshold work, and those hours are also the source of a lasting benefit, since the person who does that work comes to understand the machine's dynamics.
Where several machines are to be covered, the first installation should be treated as the pattern and the others copied from it, with the baseline repeated on each. Thresholds do not transfer between machines, because the path from the cutting edge to the sensor differs from one spindle to another.
5. Limitations and What Remains to Be Shown
The procedure is put forward as a design and has not been validated here. A validation would have to establish at least three things on real machines: that the indicator separates stable from chattering cuts over the range of tools, materials and immersions the shop uses; that the rate of false alarms is low enough for operators to keep trusting the lamp; and that detection comes early enough, in terms of the surface already damaged, to be worth having. The comparison should be made against a reference sensor of known quality and against the judgement of experienced machinists.
Some limits are inherent. A sensor on the spindle housing sees the tool's vibration through the bearings, and modes that move the tool tip a great deal may move the housing very little. When the flexible element is the workpiece, as with thin walls and floors, the vibration may not reach the spindle at all, and a microphone or a sensor on the fixture is the better choice. Cutters with unequal tooth spacing and operations with varying spindle speed spread the synchronous lines and make their removal less clean. Finally, detection is not avoidance. A shop that sees repeated alarms on one tool should measure its dynamics and select stable conditions from a stability diagram (Altintas, 2012).
6. Conclusion
A chatter detector for a milling machine can be assembled from an inexpensive accelerometer, a speed pickup and a small computer, if the design follows from the physics: chatter adds energy at frequencies that are not multiples of spindle speed, and the task is to measure that energy reliably. The eight steps described here cover the choice of band and sensor, acquisition, baseline, indicator, threshold, response and upkeep. Whether the resulting system performs well enough on a given machine is a question that only trials on that machine can settle, and the procedure is offered as a basis for such trials.
Conflict of interest
To be declared by the author(s) before publication.
Funding
To be declared by the author(s) before publication.