1. Introduction
A harvested tomato, mango or leafy vegetable is still alive. It respires, loses water and ripens, and the rate of each process rises steeply with temperature, which is why temperature management is treated as the most effective single tool for extending the life of fresh produce (Kader, 2002). In low-income regions a large share of the fruit and vegetables that are lost disappear between the field and the retail stall (Gustavsson et al., 2011; Kader, 2005). How large that share is in any one place is less certain than is often claimed, because few loss figures rest on direct measurement (Affognon et al., 2015).
Smallholders rarely have access to cooling. Grid power is absent or interrupted in many producing areas, diesel generation is costly, and conventional cold stores are built for volumes far beyond what a village assembles in a day (Kitinoja, 2013). The fall in the price of photovoltaic modules has changed the arithmetic. A walk-in room of a few cubic metres, built from insulated panels and cooled by a vapour-compression unit that runs from a solar array, is now within reach of a cooperative or a trader, and the technical options for driving refrigeration from the sun are well described (Kim and Infante Ferreira, 2008).
What is missing is a common way of saying how well such a room works where it is used. Promotional material quotes a set-point temperature and a nominal capacity. Pilot reports describe farmer satisfaction. Neither tells a prospective owner how long the room takes to cool, how evenly it holds temperature, how many cloudy days it rides through, or what a kilogram of storage costs. This article proposes a protocol for answering those questions in the field. It reports no test of any unit. Its contribution is the set of measurements, the reasoning behind them and a reporting format that would let results from different sites be read side by side.
2. Background
The protocol rests on three bodies of knowledge that are usually kept apart: the storage needs of the produce, the heat balance of a refrigerated room, and the behaviour of a stand-alone photovoltaic supply.
2.1. What the produce requires
There is no single correct cold-room temperature. Most temperate crops, including leafy vegetables, carrots and apples, keep longest close to 0 °C. Many crops of tropical and subtropical origin, among them banana, mango, tomato and aubergine, suffer chilling injury if held for long below roughly 10 to 13 °C, and the recommended conditions for each commodity are tabulated in standard references (Gross et al., 2016). Humidity matters almost as much as temperature, since produce that loses a few per cent of its mass as water wilts and loses its sale value. A room that serves a mixed smallholder harvest is therefore a compromise, and a test must state which compromise was chosen.
A second distinction is between removing field heat and holding produce cold. Rooms designed for storage have modest refrigeration capacity and gentle air movement, and they cool a warm load slowly (Thompson et al., 2008). Purpose-built precooling by forced air or water is much faster (Brosnan and Sun, 2001) but is seldom available to smallholders, so the small solar room usually does both jobs. Its performance when warm crates arrive at midday is consequently the condition that matters most and the one that laboratory ratings leave out.
2.2. The heat balance of a small room
Refrigeration engineers divide the load on a cold room into transmission through the walls, floor and roof, infiltration of warm moist air through the door, the product load made up of field heat and heat of respiration, and internal loads from fans, lights and people (ASHRAE, 2018). In a small room the surface area is large relative to the volume and the door is opened often, so transmission and infiltration account for a greater part of the total than in a commercial store. Panel joints, door seals and floor insulation, which are the places where low-cost construction tends to economise, deserve direct measurement.
2.3. The solar supply
A photovoltaic array delivers power in proportion to the irradiance falling on it, reduced by losses from module temperature, dust, wiring and power electronics (Duffie and Beckman, 2013). Cooling demand continues through the night and through overcast spells, so every design stores energy, either electrically in batteries or thermally in ice or another phase-change material. The international standard for monitoring photovoltaic systems defines the quantities needed to describe the supply side, notably the reference yield, the final yield and their quotient, the performance ratio (IEC, 2017). Using those definitions keeps a cold-room test consistent with the wider solar literature.
3. The Proposed Protocol
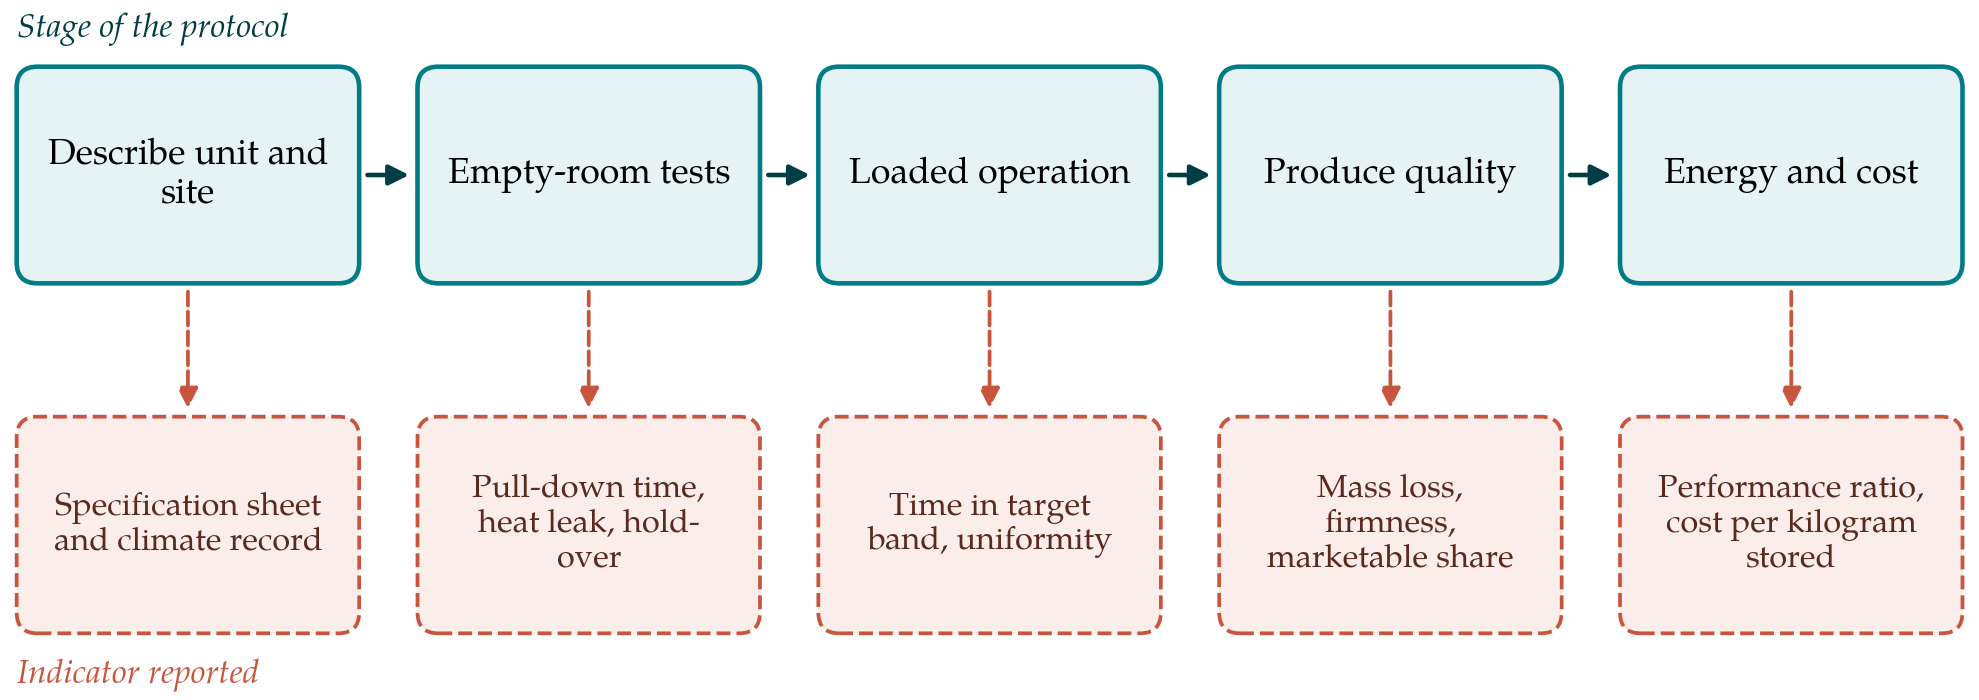
The protocol has five stages, carried out in order on a unit that is already installed and in the hands of its users. Table 1 lists the measurements and instruments for each stage, and Figure 1 pairs each stage with the indicator it yields. A full application spans at least one hot season and one cooler or wetter season, because both the cooling load and the solar resource change through the year.
| Stage | What is measured | Instruments | Duration |
|---|---|---|---|
| 1. Unit and site | Dimensions, panel type and thickness, array rating, storage type, refrigerant, set-point | Tape, nameplates, supplier documents | One visit |
| 2. Empty-room tests | Air temperature at several points, electrical input, ambient temperature | Thermocouples or thermistors, logger, power meter | Several days |
| 3. Loaded operation | Air and pulp temperature, humidity, door openings, mass loaded and removed | Loggers, door switch, platform scale, logbook | One season or more |
| 4. Produce quality | Mass loss, firmness, colour, soluble solids, decay, marketable share | Scale, penetrometer, colour chart, refractometer | Per storage trial |
| 5. Energy and cost | Irradiance, array output, energy to compressor and auxiliaries, all costs | Pyranometer or reference cell, energy meters, accounts | Whole test period |
3.1. Stage 1: Describe the unit and the site
The first stage is a record that lets a reader reconstruct what was tested. It gives the internal and external dimensions, the insulation material and thickness, the door type, the rated array power and its tilt and orientation, the kind and capacity of energy storage, the compressor and refrigerant, the control strategy and the set-point. For the site it gives the location, altitude, shading, and a summary of ambient temperature, humidity and solar radiation over the test period. It also records who uses the room, for which crops, and under what arrangement, since a room rented by the crate is loaded differently from one owned by a single farm.
3.2. Stage 2: Test the empty room
Three tests are run with the room empty and the door closed. In the pull-down test the room starts at ambient temperature and the time to reach the set-point is recorded. In the heat-leak test the room is held at a steady internal temperature by a measured electrical heater or by the refrigeration unit, and the overall heat transmission of the envelope is estimated from the steady heat flow and the difference between inside and outside temperature. In the hold-over test the solar supply is disconnected at dusk with storage fully charged, and the time for the air to rise past an agreed limit is recorded.
Air temperature is logged at not fewer than nine points: the corners at two heights and the geometric centre, with further sensors at the evaporator outlet and beside the door. All sensors are checked beforehand in a stirred ice bath, which gives a 0 °C reference without laboratory equipment, and the stated uncertainty of each derived quantity follows the conventions of the international guide (JCGM, 2008).
3.3. Stage 3: Monitor loaded operation
The room is then observed in ordinary use, without instructions to the operators beyond keeping a logbook. Loggers record air temperature and relative humidity at the positions used in Stage 2, and probes inserted into sample fruit record pulp temperature in crates near the evaporator, in the middle of the stack and by the door. A magnetic switch records each door opening and its length. The mass and kind of produce entering and leaving are weighed and written down. The indicators drawn from these records are the proportion of time the air and the pulp spend within the target band, the spread of temperature across the room, and the time warm produce takes to come within a stated margin of the set-point. Reviews of cold chain monitoring show that such time and temperature histories, more than set-points, explain the quality that reaches the buyer (Mercier et al., 2017).
3.4. Stage 4: Compare produce quality
A cold room earns its place only if produce comes out in better condition than it otherwise would. The fourth stage is a paired storage trial. A single harvest lot of one commodity is divided at random into two sets of crates; one set goes into the room and the other is kept under the shade or indoor conditions that the users would normally rely on. At intervals a subsample from each set is assessed for loss of mass, firmness, colour, soluble solids, visible decay and the share judged marketable by a trader who does not know which set it came from. The simple instruments and scoring charts described in extension manuals for small-scale handling are adequate for this purpose (Kitinoja and Kader, 2002). The trial is repeated for each main crop and in each season.
3.5. Stage 5: Analyse energy and cost
On the supply side the in-plane irradiance, array output and energy delivered to the compressor and to the fans and controls are metered continuously, and the performance ratio is calculated as the standard defines it (IEC, 2017). On the demand side the useful quantity is the electrical energy used per kilogram of produce stored per day, alongside the fraction of available solar energy that the system could not use because storage was full. Refrigerant type and any leakage are noted, since refrigeration contributes to greenhouse gas emissions through both energy use and refrigerant loss (James and James, 2010).
Costs are assembled over the expected life of the unit: purchase, transport and installation, replacement of batteries or other components, maintenance, and the operator's time. These are discounted to a present value and divided by the discounted quantity of produce stored, following the standard methods for evaluating renewable energy investments (Short et al., 1995). The result, a cost per kilogram stored per day, is the figure a farmer group can set against the price premium or the reduction in spoilage observed in Stage 4.
4. Fitting the Protocol to Limited Resources
A full application asks for instruments and attention that a development project may not have. The protocol can be applied at two levels without losing comparability. The basic level keeps Stage 1, the pull-down and hold-over tests, three air temperature loggers, the door switch, the logbook of produce mass, one energy meter and one paired quality trial per crop. Inexpensive data loggers are sufficient provided they are checked in an ice bath before and after use. The full level adds the heat-leak test, the complete sensor grid, pulp probes, irradiance measurement and separate metering of the compressor and the auxiliaries. A report states which level was followed.
Operators and users should be involved from the start. Experience with postharvest technologies in developing countries is that sound equipment often fails for reasons of management, cost recovery and fit with local marketing, and seldom for engineering reasons alone (Kitinoja et al., 2011). The logbook is therefore a source of evidence in its own right: who brought produce, how long it stayed, what was charged, and when the room stood empty.
5. Limitations and What Remains to Be Shown
The protocol is proposed here and has not been tried. Whether its measurements can be completed by a small team within one season, whether operators keep the logbook, and whether the indicators separate good designs from poor ones are open questions that only application can settle. The heat-leak test is sensitive to changing outdoor temperature and sunshine on the roof, and a steady state may be hard to reach in the field. The paired quality trial compares the room with local practice and not with an ideal cold chain, so its result is specific to the place. Mixed loads raise a further difficulty, because ethylene from ripening fruit affects neighbouring crops in ways that temperature records do not capture. The cost indicator depends on an assumed service life that young technologies cannot yet document.
6. Conclusion
Small solar cold rooms are being installed faster than they are being measured. The five-stage protocol set out in this article describes the unit, characterises the empty room, follows it through ordinary use, tests its effect on the produce and prices the service it gives. Each stage ends in an indicator defined so that results from different designs and climates can be compared. The next step is a first application on working units, reported in full, including the parts of the protocol that prove impractical.
Conflict of interest
To be declared by the author(s) before publication.
Funding
To be declared by the author(s) before publication.