1. Introduction
Milk is among the foods most often named in records of economically motivated adulteration (Moore et al., 2012). The commonest fraud is the oldest: water is added to increase volume, and other substances are then added to hide the dilution by restoring density, apparent protein, sweetness or keeping quality. Reviews list urea, starch, sucrose, salt, whey, vegetable oil, detergents, neutralisers and preservatives such as formalin and hydrogen peroxide among the materials found (Poonia et al., 2017). The melamine contamination of infant formula in China in 2008 showed how serious the consequences can be when a nitrogen-rich compound is used to defeat a protein test based on total nitrogen, and the burden of milk fraud falls most heavily where control systems are weakest (Handford et al., 2016).
Reference methods for each adulterant exist, but they are slow, need a laboratory and test for one substance at a time. Near-infrared spectroscopy offers a different bargain: a measurement that takes seconds, needs no reagents and responds to the overall composition of the sample. Miniaturised instruments have brought that capability to the point of collection (Crocombe, 2018). Feasibility studies have shown that infrared spectra, combined with multivariate analysis, can distinguish adulterated from authentic milk under laboratory conditions (Kasemsumran et al., 2007; Santos et al., 2013).
The gap between such demonstrations and a dependable screening tool is methodological. This article proposes a procedure for closing it. No experiment is reported: the procedure is assembled from established chemometric practice and has yet to be validated on milk by the route described.
2. Background
Near-infrared radiation, conventionally 780 to 2500 nm, is absorbed by overtones and combinations of the fundamental vibrations of C-H, N-H and O-H bonds. The bands are broad and overlapping, and in milk they are dominated by water, whose strong absorptions near 1450 and 1940 nm leave relatively narrow windows in which fat, protein and lactose can be seen. Milk also scatters light strongly, because fat globules and casein micelles are comparable in size to the wavelengths used, so a spectrum carries physical as well as chemical information. International guidance on near-infrared analysis of milk products sets out the consequences for sampling, calibration and validation (ISO and IDF, 2006).
Portable instruments add constraints of their own. Many cover only part of the range, often the short-wave region up to about 1700 nm, with lower resolution and signal-to-noise ratio than bench spectrometers, and units of the same model differ from one another (Crocombe, 2018). None of this prevents useful work, but it means that an adulterant present at a low concentration contributes a small signal on top of large natural variation, and that only a carefully built multivariate model can separate the two.
3. The Proposed Procedure
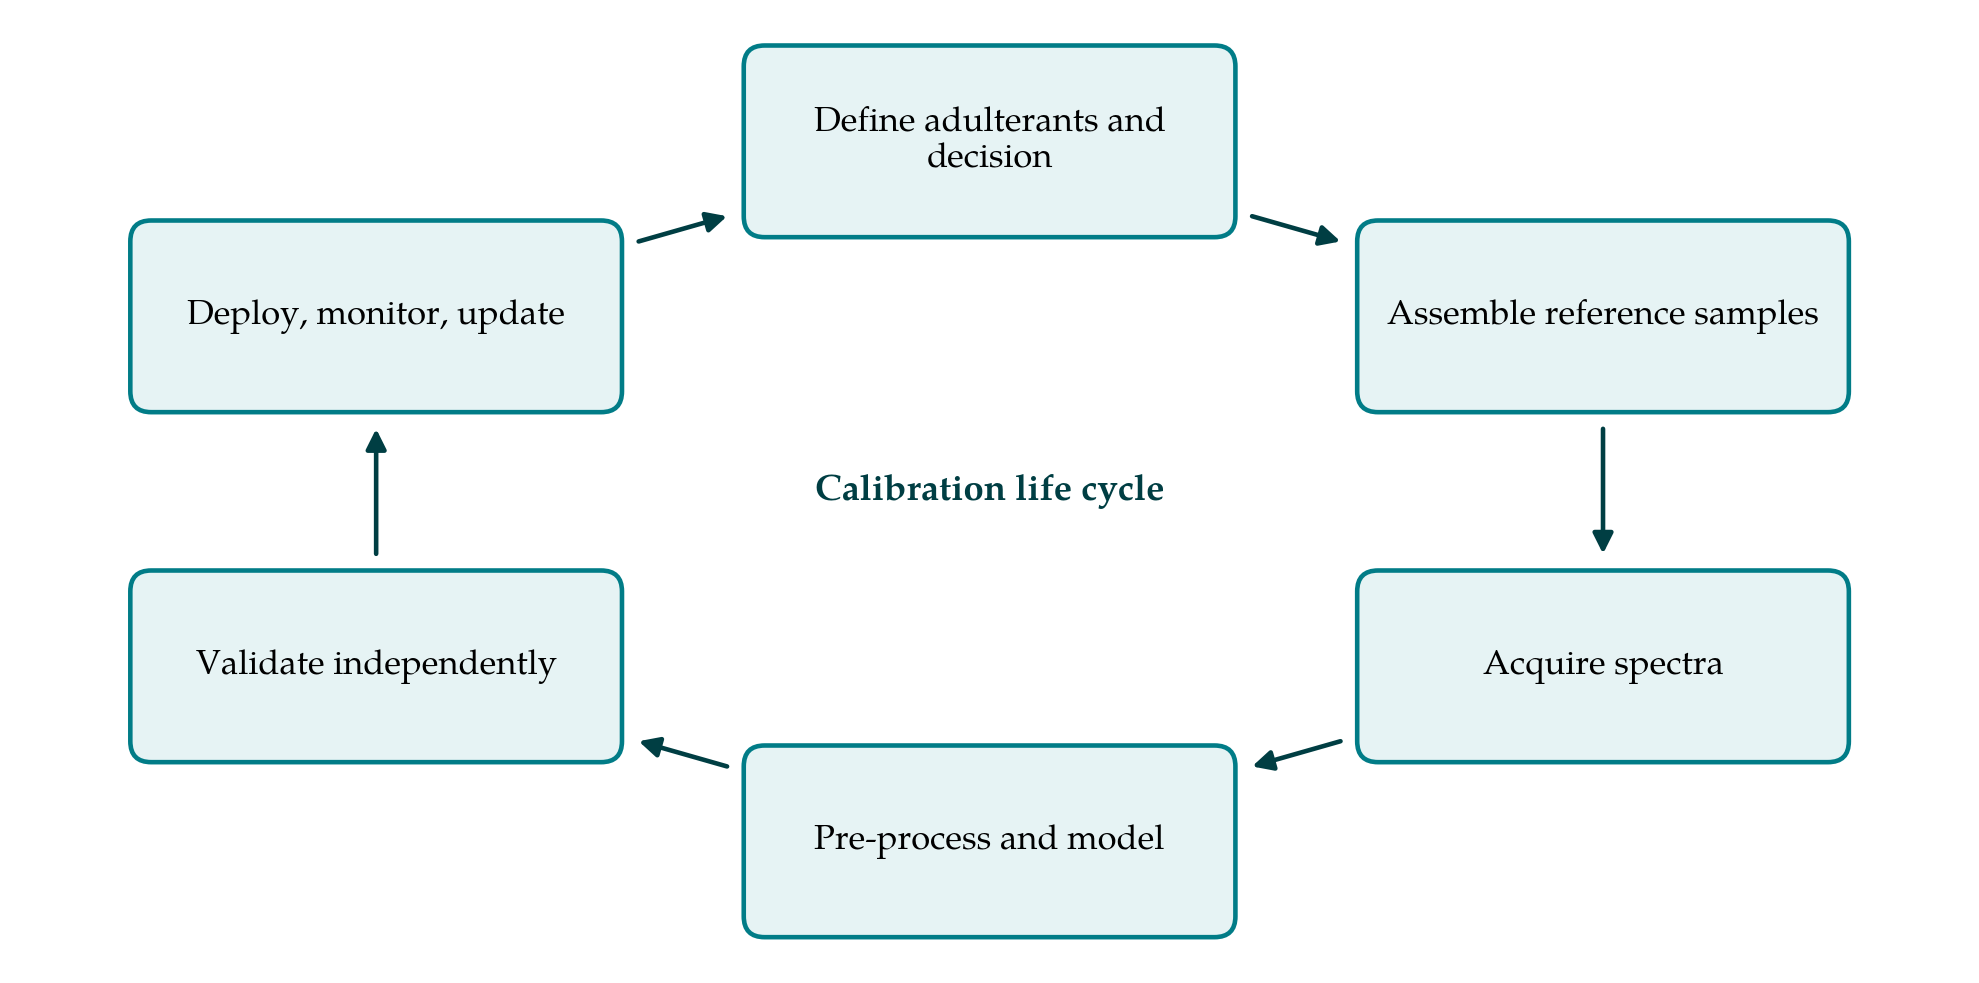
The procedure is arranged as a cycle of six stages, shown in Figure 1, because a calibration is never finished: monitoring in use feeds back into the sample set and the model. The stages are described below.
3.1. Stage 1: Define the screening question
The first decision concerns what the device is to answer. One formulation is targeted: is a named adulterant present above a stated level? The other is non-targeted: does this sample look like authentic milk? The two lead to different models and different sample sets. The developer should also fix the consequence of a positive result, normally that the lot is held and a confirmatory reference test is run, and the lowest adulteration level that is economically worthwhile for a fraudster, since there is little point in pursuing detection far below it.
3.2. Stage 2: Assemble reference samples
A calibration can only recognise variation it has seen. The authentic set should therefore span the sources of natural variability in the milk the device will meet: breeds, stages of lactation, seasons, feeding systems, farms, and morning and evening milkings. Authenticity must be assured, in practice by supervised milking or collection. Adulterated samples are prepared by spiking authentic milk at graded levels around the level of interest, using many different base milks so that the model cannot learn the base instead of the adulterant. Combined adulterations, such as water with urea or with sucrose, should be included because they are what fraud looks like in practice. Reference values, where regression is intended, come from the gravimetric preparation and from standard methods.
3.3. Stage 3: Acquire spectra under controlled conditions
Spectra of milk are sensitive to temperature, which shifts the water bands, and to the state of the fat. Samples should be brought to a fixed temperature and mixed gently before measurement, in a cell or probe of fixed path length, with the measurement mode (transmission, transflectance or diffuse reflectance) kept constant. Each sample is scanned in replicate with repositioning, a reference or background is recorded at set intervals, and the order of measurement is randomised so that drift does not line up with adulterant level. Instrument serial number, operator, date and ambient conditions are logged, since they will be needed later to explain model failures.
3.4. Stage 4: Pre-process, explore and model
Pre-processing removes variation unrelated to composition. Standard normal variate transformation (Barnes et al., 1989) and multiplicative scatter correction (Geladi et al., 1985) reduce the effect of scatter, and Savitzky-Golay derivatives remove baseline offsets and sharpen overlapping bands (Savitzky and Golay, 1964). Rinnan et al. (2009) review these techniques and caution that every additional step can remove information as well as noise; the simplest treatment that works should be preferred. A principal component analysis of the pre-processed spectra is then examined for outliers, for clustering by day or instrument, and for any visible trend with adulteration.
Three families of model are available, and Table 1 compares them. Partial least squares regression relates spectra to a concentration and suits a targeted, quantitative question (Wold et al., 2001). Partial least squares discriminant analysis assigns a sample to one of several predefined classes (Barker and Rayens, 2003). Class-modelling methods, of which soft independent modelling of class analogy is the best known, describe the authentic class alone and reject whatever falls outside it. Rodionova et al. (2016) argue that authentication is properly a class-modelling problem, because the set of possible adulterants is open-ended and a discriminant model is forced to place an unfamiliar sample in one of its known classes. The procedure proposed here follows that reasoning: a one-class model of authentic milk as the primary screen, supplemented by regression models for the few adulterants of greatest local concern.
| Approach | Question answered | Strength | Limitation |
|---|---|---|---|
| One-class modelling (e.g. SIMCA) | Is the sample consistent with authentic milk? | Can flag adulterants not in the training set | Needs a broad authentic set; no identification |
| PLS discriminant analysis | Which predefined class does it belong to? | Good separation of known adulterants | Unknown adulterants are forced into a known class |
| PLS regression | How much of a named adulterant is present? | Gives a level to compare with a threshold | One model per adulterant; needs reference values |
| Principal component analysis | What structure do the spectra show? | Reveals outliers, drift and batch effects | Exploratory only; makes no decision |
| Combined scheme (proposed) | Authentic or not, then what and how much? | Screens broadly, then characterises | More models to validate and maintain |
3.5. Stage 5: Validate with independent samples
Validation decides whether the model can be believed. The samples are divided into a calibration set and a test set before modelling begins, and the test set is not touched until the model is final. The split should keep all spectra of a given base milk on the same side; otherwise replicates leak across and the error is flattered. The Kennard-Stone algorithm offers one way to choose a calibration set that covers the spectral space evenly (Kennard and Stone, 1969). Cross-validation within the calibration set guides the number of latent variables, but Westerhuis et al. (2008) showed how readily discriminant models overfit and recommend permutation tests and a strictly separate test set as safeguards.
Performance should be expressed in terms the user can act on. For a classification screen these are sensitivity and specificity at each adulteration level, reported with the number of independent base milks behind them; for regression, the root mean square error of prediction, bias, and an estimate of the lowest level reliably detected. A final test on milk collected at a different time and place from the calibration samples is the strongest evidence, because it exposes the model to variation the developer did not choose.
3.6. Stage 6: Deploy, monitor and update
A model built on one instrument rarely transfers unchanged to another. Calibration transfer methods map the response of a second instrument onto the first using a small set of samples measured on both; direct and piecewise direct standardisation are the classical approaches (Wang et al., 1991), and the wider family is reviewed by Feudale et al. (2002). In the field, a stable check sample is measured daily and plotted on a control chart, operators follow a written measuring routine, and a share of screened lots, negatives as well as positives, is sent for reference analysis. Samples that the model handles badly are added to the calibration set at the next revision, which closes the cycle.
4. Fitting the Procedure to Practice
The effort involved is front-loaded. Collecting authentic milk across seasons takes a year, and the developer should resist releasing a model built on a single season's samples. A dairy company, a cooperative union or a regulator is better placed than a single collection centre to carry that cost, and a shared calibration maintained centrally and distributed to many devices is the natural arrangement. Operators need training in sample handling far more than in chemometrics, since most field errors arise from temperature, mixing and dirty optics.
Results must be interpreted within a decision rule fixed in advance. A positive screen is grounds for holding a lot and testing it by a reference method; it is not proof of fraud and should not, by itself, lead to a penalty. A negative screen means only that the sample resembles authentic milk within the sensitivity of the method.
5. Limitations and What Remains to Be Shown
The procedure is a proposal and has not been tested here. What a portable instrument can detect in liquid milk by following it is an open, empirical question that depends on the adulterant, the device and the variability of the local milk. Near-infrared spectroscopy is a bulk technique. Dilution with water and additions that change composition by an appreciable fraction are plausible targets; contaminants that are harmful at trace levels, of which melamine is the best-known example, are not realistic targets for direct screening of liquid milk with this technology, and claims to the contrary should be examined against the validation design that supports them.
Further matters would need to be established before routine use: how many authentic samples are needed for a one-class model to be stable across seasons, how often models require updating, how well transfer methods cope with the unit-to-unit differences of low-cost devices, and whether the rate of false alarms is low enough for collection staff to keep trusting the instrument. Each can be answered by a study that follows the stages set out above and publishes its independent test results in full.
6. Conclusion
Portable near-infrared spectrometers put a rapid, reagent-free measurement in the hands of those who receive milk, but the measurement becomes a screening test only through calibration. The procedure proposed in this article treats that calibration as a managed life cycle: a clearly stated question, a reference set that captures natural variation, disciplined acquisition, restrained pre-processing, a one-class model backed by targeted regressions, validation on independent milk, and continuing control after deployment. Followed carefully, it should yield models whose limits are known, which is the property a screening method most needs.
Conflict of interest
To be declared by the author(s) before publication.
Funding
To be declared by the author(s) before publication.