1. Introduction
Some freshwater fish are almost never seen. Large catfishes that hold in deep channels, burrowing eels, small benthic species of fast turbid runs and migratory fish present for a few weeks of the year can escape years of conventional sampling, and their conservation status is assessed from a handful of records. The demonstration that a vertebrate could be detected from DNA in a water sample (Ficetola et al., 2008) offered a way round the difficulty, and the method was soon used to trace invasive carps in turbid canals beyond the points where conventional gear had caught them (Jerde et al., 2011).
The practice of environmental DNA (eDNA) surveying has since been codified. Guidance on field collection, laboratory controls and reporting is available (Goldberg et al., 2016), and the behaviour of eDNA in water, its origin, state, transport and fate, has been reviewed in detail (Barnes and Turner, 2016). Much of the underlying work, however, was done in clear headwater streams, ponds and experimental tanks. The rivers in which many of the least known fish live are wide, deep and brown with suspended sediment for much of the year, and a protocol written for a trout stream transfers to them poorly.
This article sets out a sampling design intended for that setting. It is addressed to survey teams that have access to a quantitative PCR laboratory and want to establish whether a particular species is present along a reach of turbid river. The design is a proposal built from the published literature. It has not been tested in the field as part of this work, and no results are reported.
2. Background
Three bodies of knowledge shape the design: how eDNA moves in flowing water, what suspended sediment does to capture and amplification, and how imperfect detection is handled statistically.
2.1. Environmental DNA in flowing water
A river carries eDNA away from its source. Experiments with caged fish in small streams showed that the signal can be detected downstream of the animals and that the distance and strength of detection change with discharge (Jane et al., 2015). In a larger system, DNA of lake-dwelling invertebrates was recovered several kilometres down the outflowing river (Deiner and Altermatt, 2014). A positive sample therefore indicates that the species is somewhere upstream within a distance that depends on flow, and a sampling layout must be read with that in mind. Most fish eDNA is not free molecules but sits in cells and fragments of tissue: size fractionation of carp eDNA found the bulk of it in particles between about one and ten micrometres (Turner et al., 2014), which is why filtration, and the choice of pore size, matters so much.
2.2. What turbidity changes
Suspended sediment affects every stage of the method. Fine filters block after a fraction of a litre, so the volume screened per sample falls and with it the chance of capturing a rare molecule. Work in turbid tropical waters found that coarser filters allowed much larger volumes to be processed before clogging (Robson et al., 2016), and alternatives to conventional filtration have been compared for turbid water specifically (Williams et al., 2017). Clay and organic matter retained on the filter are extracted along with the DNA and can inhibit PCR, producing false negatives unless inhibition is tested for and removed (McKee et al., 2015). Finally, DNA bound to particles settles. Carp eDNA was found to be more concentrated in bed sediment than in the overlying water and to persist there longer (Turner et al., 2015), so that a flood or a careless boot can return old DNA to the water column.
2.3. Imperfect detection
A species that is present may be missed at three levels: its DNA may be absent from the water at the site on the day, absent from the sample taken, or unamplified in the PCR replicate. Site occupancy models estimate the probability of presence while accounting for detection below one (MacKenzie et al., 2002). Schmidt et al. (2013) showed how the approach applies to eDNA, and hierarchical versions with separate parameters for sites, samples and PCR replicates are implemented in freely available software (Dorazio and Erickson, 2018). These models require replication at each level, which is the main reason the design below specifies it.
3. The Proposed Design
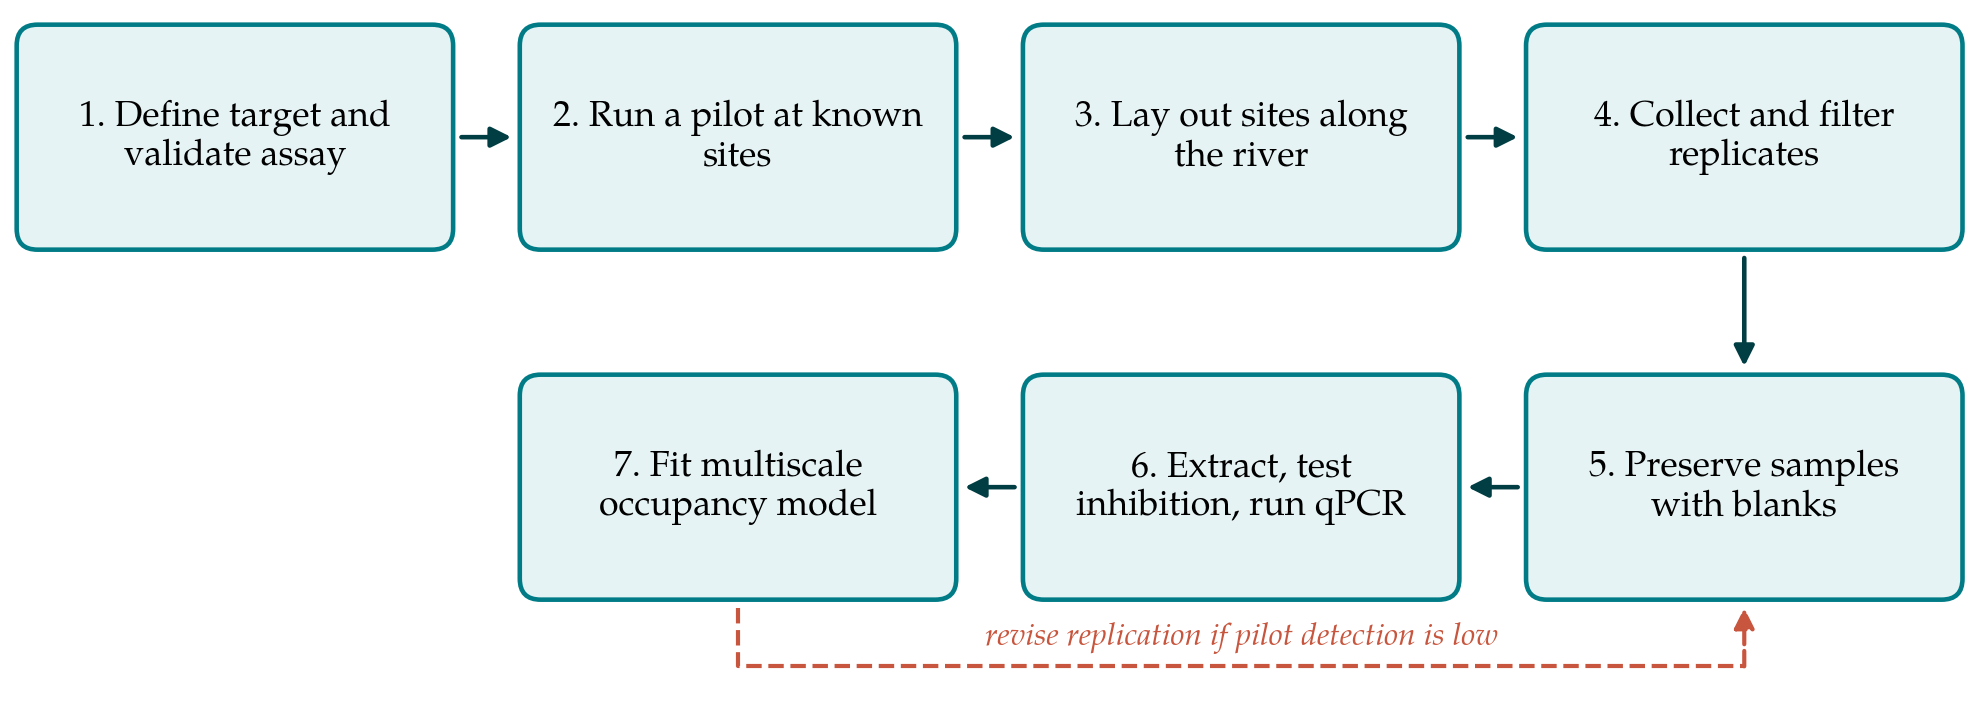
The design has seven steps, shown in sequence in Figure 1. Table 1 sets the main decisions against the practice usual in clear water and gives the reason for each departure.
| Decision | Usual in clear water | Proposed for turbid rivers | Reason |
|---|---|---|---|
| Filter | Fine pore, single filter | Coarser pore or pre-filter; several filters per sample | Clogging limits volume |
| Volume | Fixed volume | Filter to clogging; record volume passed | Volume varies with sediment load |
| Sampling point | Bank or mid-channel surface | Flowing water away from disturbed bed | Avoids resuspended sediment DNA |
| Season | Any convenient time | Falling or low water where possible | Lower sediment load and dilution |
| Inhibition | Checked occasionally | Internal control in every reaction | Clay and humic matter inhibit PCR |
| Replication | Often minimal | Replicated samples and PCR runs at each site | Needed for occupancy estimation |
3.1. Step 1: Define the target and validate the assay
A species-specific assay is preferable to metabarcoding when one rare fish is sought, because all the sequencing effort goes to the target. The primers and probe must be tested in silico and against tissue DNA of every related species in the basin, since an assay with too few mismatches to a common relative will produce false positives (Wilcox et al., 2013). The limit of detection and limit of quantification should be determined and reported in the standard way (Klymus et al., 2020), and assay details recorded in line with the MIQE guidelines (Bustin et al., 2009). Reference sequences for poorly known river fish are often missing, and obtaining vouchered tissue may be the first task.
3.2. Step 2: Run a pilot at sites of known status
Before the survey proper, the full protocol is run at a small number of places where the species is known to be present, such as a fishing ground with recent catches, and at one where it is certainly absent. The pilot shows what volume can be filtered at the prevailing turbidity, whether extracts are inhibited, and roughly what proportion of samples and PCR replicates are positive where the fish exists. Those proportions feed the replication plan in Step 4. A pilot that yields no positives at a known site signals a problem with capture or amplification that must be solved before any absence elsewhere can be interpreted.
3.3. Step 3: Lay out sites along the river
Sites are placed in relation to habitat and to hydrology. Because the signal travels downstream, sites are spaced so that each can be interpreted as integrating the reach above it, and are positioned below likely habitat such as deep pools, confluences and rocky runs. Sampling immediately below a tributary junction is avoided unless the tributary is itself of interest, since incomplete mixing can hide or misplace a signal. Where the channel is wide, samples are taken from more than one point across it. Turbidity, temperature, pH and an estimate of flow are recorded at each visit as covariates of detection.
3.4. Step 4: Collect and filter replicated samples
At each site several independent water samples are taken from flowing water, upstream of the boat or the operator and clear of the bed. Each is passed through a filter of relatively coarse pore size, or through a pre-filter followed by a finer one, until flow stops, and the volume passed is recorded. Using two or more filters per sample and pooling them at extraction raises the volume screened. The number of samples per site is set from the pilot using the reasoning of Furlan et al. (2016), who give a framework for calculating the sensitivity of an eDNA survey from detection probabilities at each level. Where pilot detection is low, more samples per site are worth more than more PCR replicates per sample.
3.5. Step 5: Preserve samples and control contamination
Filters are preserved at once, in ethanol or a lysis buffer, or kept on ice and frozen the same day. Equipment that touches water is single-use or decontaminated with dilute bleach between sites. A field blank of clean water is filtered at every site with the same equipment and carried through the whole process. These measures are standard (Goldberg et al., 2016), but they deserve more care on a muddy river bank, where sediment on hands, ropes and boat decks is a ready vehicle for DNA from the previous site.
3.6. Step 6: Extract, test for inhibition and run quantitative PCR
Extraction should use a method shown to cope with sediment-laden filters, and extraction blanks are included in each batch. Every reaction carries an internal positive control so that inhibition shows as a delay or failure of the control. Inhibited extracts are cleaned with an inhibitor-removal column or diluted and run again; both remedies have costs, since columns lose some DNA and dilution lowers the target concentration (McKee et al., 2015). Each extract is run in several PCR replicates with no-template controls on every plate. A subset of positive amplicons is sequenced to confirm identity. The criterion for calling a sample positive is fixed before the survey and stated in the report.
3.7. Step 7: Analyse detections with a multiscale occupancy model
The detection histories, sites by samples by PCR replicates, are analysed with a multiscale occupancy model (Dorazio and Erickson, 2018). Turbidity and filtered volume enter as covariates of the probability that a sample contains target DNA, and the inhibition result can enter at the PCR level. The output of the survey is then an estimated probability of occupancy for each site with its uncertainty, together with the cumulative probability of detection achieved by the effort applied. A site with no detections is reported with the probability that the species was present and missed, not as an absence.
4. Fitting the Design to Field Conditions
Turbid rivers are often remote, and the design has to survive a boat, heat and the absence of mains power. Hand or battery pumps and enclosed filter housings reduce handling. Preservation in buffer at ambient temperature removes the need for ice. Filtering on site is preferable to transporting bulk water, which is heavy and in which DNA continues to degrade. Timing deserves thought: sampling on the falling limb of the flood or in the dry season gives lower sediment loads and less dilution, though it must be weighed against the season in which the target fish is present or spawning, when shedding of DNA is likely to be greatest.
Interpretation needs local knowledge. A positive result near a fish market, a landing site or a settlement where the species is eaten may reflect discarded tissue or wastewater and not a living population. Fishers can often say where such inputs occur and where the species was last caught, and their information is as useful in placing sites as any map of habitat.
5. Limitations and What Remains to Be Shown
The design is proposed and has not been validated here. Several of its choices rest on studies of other species in other waters, and their transfer to a given river is an assumption until tested. Field trials would need to establish at least three things. The first is whether coarse filtration to clogging recovers more target DNA per unit effort than small volumes through fine filters across the range of turbidity met in the river concerned. The second is how far downstream a detectable signal travels at different discharges, which determines what a positive site means spatially. The third is how often resuspended sediment yields positives in reaches the fish no longer occupies.
Two limits are inherent. An eDNA detection says nothing about abundance, age structure or breeding, and it should prompt, not replace, targeted conventional sampling where a species of concern is found. And for fish known from very few specimens, the lack of reference sequences from across the range means that an assay may fail on an unsampled lineage. Negative results for such species should be treated with particular caution.
6. Conclusion
Turbidity does not prevent eDNA surveys for rare river fish, but it alters the choices at every step. The design proposed here answers clogging with coarser filtration and recorded volumes, sediment-borne DNA with careful placement and timing of samples, inhibition with a control in every reaction, and uncertain detection with replication and a multiscale occupancy analysis. Each element comes from published work; their combination in a single protocol for turbid rivers still has to be tried, and the trials outlined above would show whether it performs as intended.
Conflict of interest
To be declared by the author(s) before publication.
Funding
To be declared by the author(s) before publication.