1. Introduction
A beam is treated as deep when its span is short in relation to its depth, or when a concentrated load acts close to a support; the American building code sets the limits at a clear span of four times the overall depth and a load within twice the depth from the support face (ACI Committee 318, 2019). In such members plane sections do not remain plane, and load travels to the support through an inclined compressive strut tied by the longitudinal reinforcement, the picture formalised in strut-and-tie design by Schlaich et al. (1987). The classic tests of Kani (1964) showed how strongly the shear strength of members without stirrups rises as the shear span shortens and arch action takes over from beam action.
When no stirrups cross the diagonal crack, the force that the cracked web can still carry depends on what happens at the crack itself: interlock of aggregate across its rough faces, dowel action of the longitudinal bars, residual tension near the tip, and compression above it (Fenwick and Paulay, 1968). Aggregate interlock in particular is a function of both the opening and the sliding of the crack faces, as Walraven (1981) established. A test that is to inform a mechanical model must therefore deliver crack kinematics, and not just the load at failure.
Digital image correlation is well suited to the task, and several research groups have used it to follow critical shear cracks in slender members (Campana et al., 2013; Cavagnis et al., 2015; Huber et al., 2016). Deep beams pose additional demands: cracks are steeper and open less before failure, the strut region is under high biaxial stress, and failure is abrupt. This article proposes a protocol for these conditions. It describes a procedure and gives its reasoning; it reports no tests.
2. Background
The protocol draws on two bodies of knowledge, the measurement technique and the mechanics it is meant to serve.
2.1. Digital image correlation
The method tracks a random surface pattern through a series of images. The reference image is divided into small subsets, and for each the algorithm finds the position and deformation in a later image that best matches its grey-level distribution, which yields a displacement vector at the subset centre (Sutton et al., 2009). One camera gives in-plane displacements of a flat surface; two calibrated cameras give the three-dimensional shape and all three displacement components. The review by Pan et al. (2009) sets out the sources of error: pattern quality, subset size, the shape function, grey-level interpolation, lens distortion, lighting changes and camera noise. Sub-pixel interpolation introduces a systematic bias (Schreier et al., 2000), and with a single camera any movement of the specimen toward or away from the lens appears as a false in-plane strain (Sutton et al., 2008).
The International Digital Image Correlation Society has published a good practices guide that covers general test design and lists what should be reported (Jones and Iadicola, 2018). The guide is written for all materials and for strain measurement in general. It does not address the extraction of discrete cracks, which is the purpose here.
2.2. Crack kinematics in shear models
Mechanical models of shear in members without stirrups are written in terms of the shape and movement of the critical crack. The two-parameter kinematic theory of Mihaylov et al. (2013) describes the deformation of a deep beam by the average strain in the bottom reinforcement and the vertical displacement of the critical loading zone, and predicts the crack opening and sliding from them. Aggregate interlock relations, including the simplified forms within the modified compression field theory (Vecchio and Collins, 1986), take the crack width as their principal variable. To check such models, a test must supply the crack path and the relative displacement of its faces at many points and many load stages.
3. The Proposed Protocol
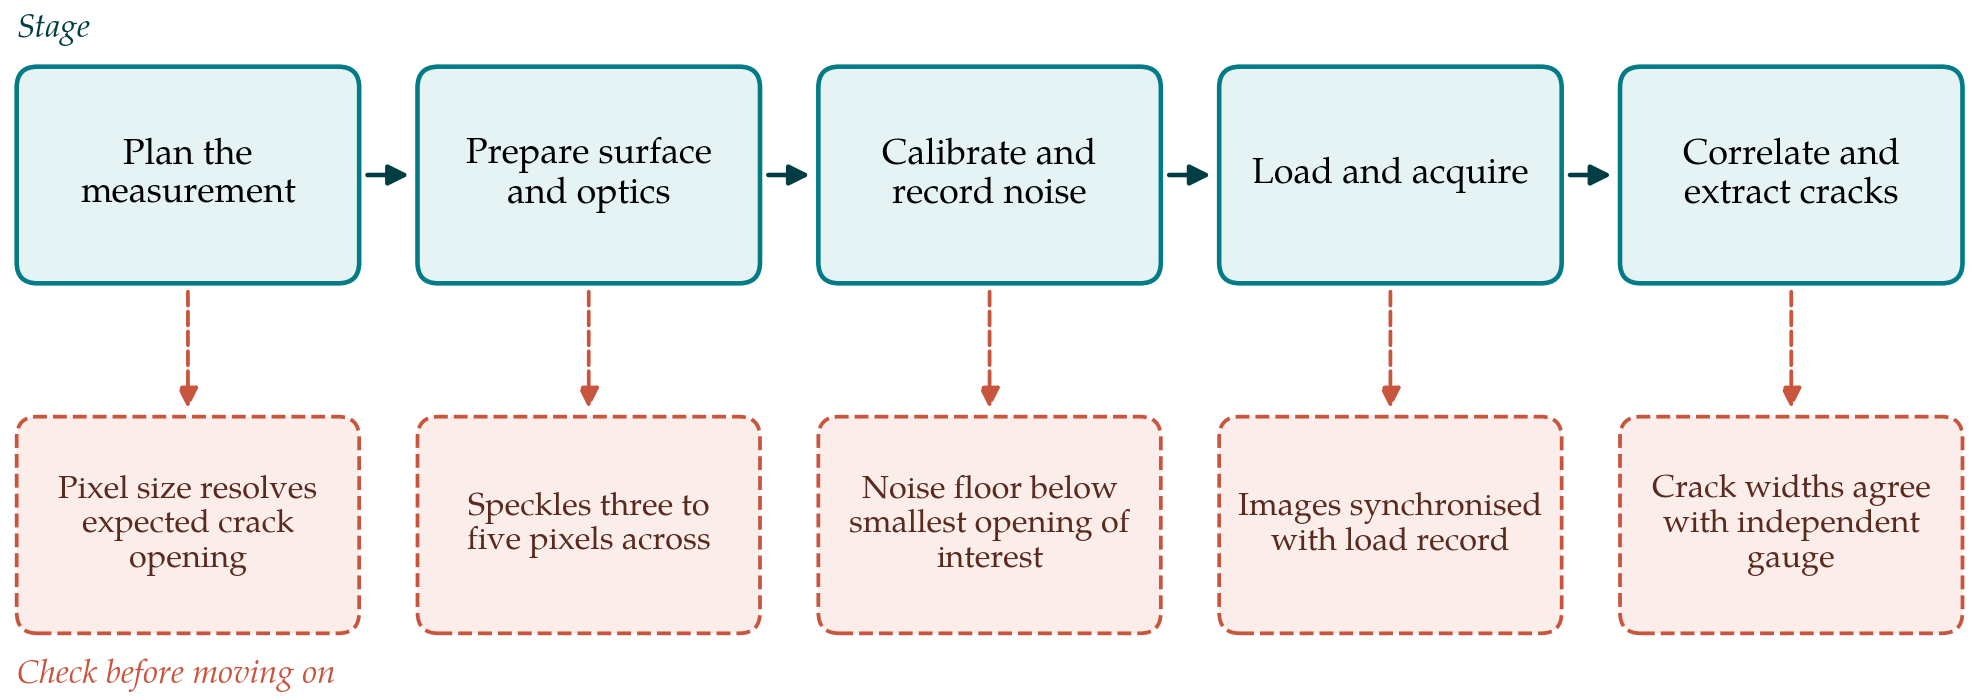
The protocol is organised in five stages, each closed by a check, as shown in Figure 1. Table 1 gives suggested starting values for the settings discussed. They are starting points drawn from the guidance cited and should be confirmed for each set-up through the checks; they are not validated optima.
| Setting | Suggested starting point | Reasoning |
|---|---|---|
| Field of view | Full shear span plus a margin at each plate | Position of the critical crack is not known beforehand |
| Camera arrangement | Stereo pair on the measured face | Removes false strain from out-of-plane movement Sutton et al., 2008 |
| Speckle size | Three to five pixels | Avoids aliasing while keeping subsets small Jones and Iadicola, 2018 |
| Subset size | Large enough to hold at least three speckles | Unique matching; larger subsets blur the crack |
| Step size | About a third to a half of the subset | Dense displacement data along the crack path |
| Static images | A series before loading, repeated at holds | Gives the noise floor and reveals drift |
| Gauge length across crack | A little more than one subset on each side | Displacement jump is taken from undisturbed data |
| Independent check | Displacement transducers or crack gauge at two points | Validates the extracted openings |
3.1. Stage 1: Plan the measurement
Planning starts from the smallest crack opening that the test needs to resolve and works backward. A well-conducted correlation resolves displacement to a small fraction of a pixel, so the physical size of a pixel on the specimen sets the displacement resolution. The field of view is chosen to cover the whole shear span from load plate to support plate, with a margin, because the position of the critical crack is not known in advance. If that field of view gives a pixel too coarse for the opening of interest, the choice is between a higher-resolution sensor, a second camera pair covering the expected crack region at closer range, or acceptance of a higher threshold. The decision should be made and recorded before the beam is cast.
The second planning decision is between one camera and two. A deep beam under load moves and may rotate slightly out of its plane at the supports, and the web can bulge as the strut approaches crushing. For this reason a stereo system is recommended for the measured face. Where only one camera is available, a long stand-off distance reduces the false strain from out-of-plane movement, and a displacement transducer normal to the face should record that movement so that its effect can be bounded.
3.2. Stage 2: Prepare the surface and the optics
The measured face is cleaned, coated with a thin matt white paint and given a random black speckle pattern. The pattern should have high contrast, no preferred direction and roughly equal areas of black and white, with individual speckles some three to five pixels across in the image; smaller speckles alias and larger ones force larger subsets (Jones and Iadicola, 2018). For a shear span of the order of a metre this implies speckles of about a millimetre, applied by stencil, roller or spray and checked in a trial image. Lighting must be even and steady. Diffuse light-emitting diode panels are preferable to laboratory daylight, and the exposure should use the available grey-level range without saturating. The lens aperture is set for a depth of field that keeps the whole face sharp, and focus, aperture and camera position are then locked.
3.3. Stage 3: Calibrate and record the noise floor
A stereo system is calibrated with a target of known geometry moved through the measurement volume, which determines the intrinsic parameters of each camera and their relative position; the underlying technique is that of Zhang (2000). A single camera needs at least a scale and a distortion correction. With the beam in the rig and unloaded, a series of images is then taken and correlated against the first. Since nothing has moved, the scatter of the computed displacements is the noise floor of the whole measurement chain. The check for this stage is that the noise, expressed as an apparent crack opening using the same extraction settings that will be used later, is clearly smaller than the smallest opening of interest. If it is not, lighting, pattern or resolution must be improved before loading.
3.4. Stage 4: Load and acquire
Loading should be under displacement control so that the post-cracking response can be followed. Images are triggered together with the readings of load and of the conventional transducers, so that every image carries a load value. A modest frame rate is adequate while the beam is uncracked. Because failure of a deep beam without stirrups is sudden, the rate should be raised once diagonal cracking is seen, and a camera with a rolling buffer is useful for capturing the last images before the strut fails. At each load hold a short burst of images allows the noise to be rechecked and the influence of creep during the hold to be seen. The opposite face of the beam remains available for conventional crack mapping by eye, which gives an independent record of the crack pattern.
3.5. Stage 5: Correlate and extract crack kinematics
Correlation settings govern how sharply a crack is rendered. The subset must be large enough to contain several speckles for a unique match, and no larger, since a subset that straddles a crack returns a displacement that belongs to neither side. Strains computed by differentiating the displacement field are useful for locating cracks, which appear as bands of high apparent principal strain, but they are not a physical strain once the concrete has cracked, and their magnitude depends on the gauge length of the strain calculation. Open-source and commercial correlation codes both allow these settings to be controlled (Blaber et al., 2015), and every one of them should be reported.
Crack kinematics are obtained from displacements, not strains. Once the crack path has been traced from the strain map, pairs of points are placed on either side of it at regular intervals along its length, far enough from the crack that their subsets lie wholly in uncracked material. The relative displacement of each pair, resolved normal and tangential to the local crack direction, gives the opening and the sliding at that location. This is the procedure used on slender members by Campana et al. (2013) and Cavagnis et al. (2015), and automated versions have been published (Gehri et al., 2020). The crack tip at a given load stage is taken as the point where the opening falls to the noise floor recorded in Stage 3, which makes the reported tip position explicitly dependent on the resolution of the measurement.
The closing check compares openings extracted from the images with those from the independent gauges at the same locations and load stages. Agreement within the noise floor validates the chain from image to opening for that test. Disagreement is investigated before any of the kinematic data are used.
4. Fitting the Protocol to a Laboratory
The protocol does not presuppose particular equipment. A laboratory with a single industrial camera can follow it by accepting a coarser resolution or a smaller field of view and by bounding the out-of-plane error, and should state that it has done so. What the protocol does require is that the decisions of Stage 1 are made before testing and that the checks are recorded with the results. The reporting list of the good practices guide, with the crack extraction settings added, the gauge length across the crack and the threshold used for the tip, is sufficient for another laboratory to judge and repeat the measurement (Jones and Iadicola, 2018).
5. Limitations and What Remains to Be Shown
The protocol is a proposal. It has not been applied to a test series for this article, and the starting values in Table 1 are drawn from general guidance and not from trials on deep beams. Their adequacy for the small openings that precede strut failure remains to be demonstrated, ideally by a comparison across laboratories testing nominally identical beams.
Some limits are inherent in the technique. Image correlation sees the surface only. Crack paths and openings inside a wide member may differ from those on the face, and the assumption that surface kinematics represent the section weakens as width grows. The pattern is lost wherever cover spalls, which in a deep beam tends to happen in the strut and near the plates shortly before failure, precisely where and when the data are most wanted. Closely spaced cracks in the fan region under a load plate may lie nearer to each other than the gauge length needed to separate them. Finally, opening and sliding are resolved relative to a crack direction estimated from the image, and on a rough crack the local direction is itself uncertain, which affects sliding more than opening.
6. Conclusion
Shear tests on deep beams without stirrups are more valuable when they record how the critical crack opens and slides than when they record the failure load alone. Digital image correlation can supply that record if resolution, pattern, calibration, acquisition and processing are planned around the crack openings to be measured. The five-stage protocol proposed here ties each of those choices to a check and asks that settings and checks be reported together. Whether it yields kinematic data of the quality that current shear models need is a question for experimental validation, which this article invites.
Conflict of interest
To be declared by the author(s) before publication.
Funding
To be declared by the author(s) before publication.