1. Introduction
Environmental science has long wanted more measurement points than it could afford. The case for networks of many inexpensive stations in place of a few costly ones was made for the earth sciences by Hart and Martinez (2006), and early deployments of wireless motes for habitat monitoring showed both the promise and the fragility of the idea (Mainwaring et al., 2002). Commercial data loggers are dependable and well supported, but a price per unit that is reasonable for a research catchment with a handful of stations becomes prohibitive when the design calls for dozens of stations, or when the network is to be run by a water authority or university in a low-income region.
Open-source hardware has changed the arithmetic. Pearce (2012) argued that research equipment built from open designs and commodity parts could cost a small fraction of proprietary equivalents, and loggers were among the first instruments to which the approach was applied (Fisher and Gould, 2012). Several designs have since been described in enough detail to copy, among them the ALog family for field geoscience (Wickert, 2014; Wickert et al., 2019), the Cave Pearl logger assembled from hobbyist modules (Beddows and Mallon, 2018), and Arduino-based hydrological stations for data-scarce regions (Hund et al., 2016).
These projects have also exposed recurring difficulties, which reviews of low-cost sensing describe frankly (Mao et al., 2019; Chan et al., 2021). This article proposes a design method that takes those difficulties as its starting point. It describes a logger architecture and the reasoning behind each choice, and it is offered as a specification to be built and tested. No prototype results are reported, and none should be inferred.
2. Background: Lessons From Existing Open Loggers
Four lessons recur in the published accounts. The first concerns energy. A development board that draws tens of milliamperes continuously will exhaust a set of alkaline cells within days, and the long-running designs achieve their endurance by removing or bypassing voltage regulators, indicator lights and serial converters that the hobbyist board carries for convenience, and by cutting power to the memory card, which can otherwise dominate the sleep current (Beddows and Mallon, 2018). The second concerns time. The resonator on a microcontroller board is not a clock, and a network whose stations disagree about the time by minutes cannot resolve the passage of a flood wave or a weather front.
The third lesson concerns the analogue front end. Low-cost boards measure voltage against the supply rail or an internal reference of modest stability, so readings from resistive sensors drift with battery voltage and temperature unless the measurement is arranged to cancel the reference. The fourth concerns what happens after collection. Horsburgh et al. (2019) observe that the hardware is the easier half of a low-cost network, and that data without consistent identifiers, units and site metadata are of limited use. To these may be added the meteorological community's long-standing insistence that a measurement is defined by its siting, exposure and maintenance as much as by its sensor (WMO, 2018).
3. The Proposed Design Method
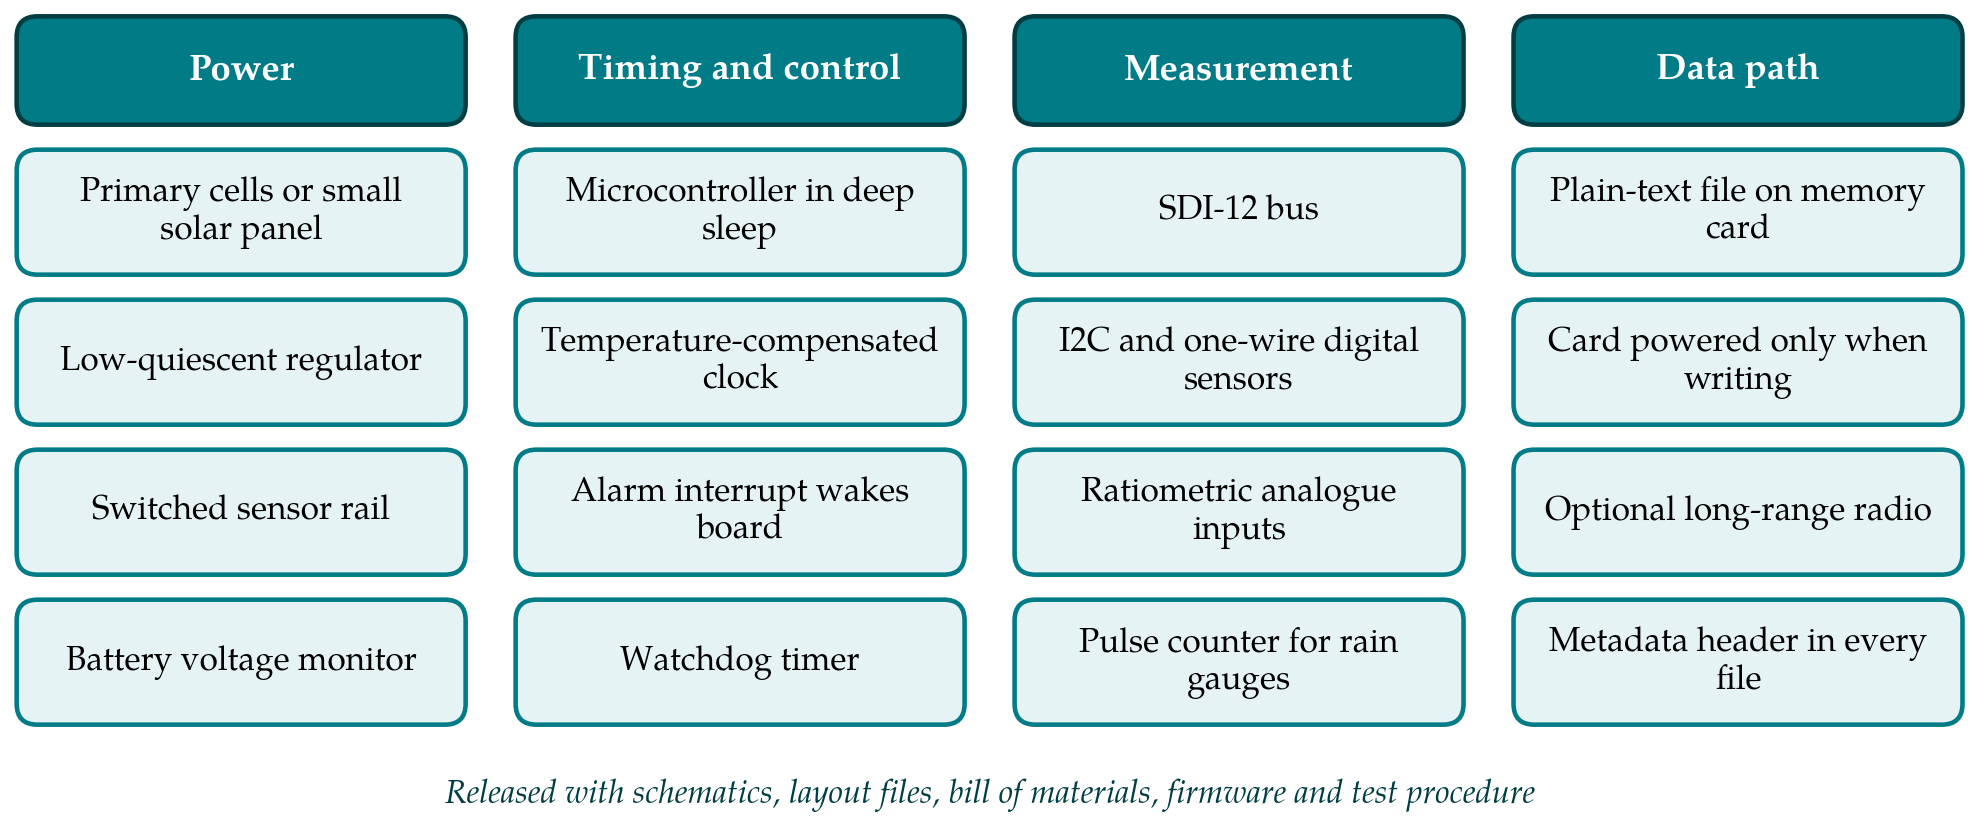
The method proceeds in six steps: write the energy budget, fix the core architecture, design the sensor interfaces, design the data path, prepare the release package, and plan verification. The resulting architecture is summarised in Figure 1, grouped into the four subsystems that the steps address, and the principal design decisions are collected in Table 1 with the reason for each.
| Design decision | Proposed choice | Reason |
|---|---|---|
| Energy planning | Written budget before component selection | Sleep current decides battery life at long sampling intervals |
| Processor board | Purpose-made board, Arduino-compatible | Removes always-on parts; keeps a familiar tool chain (Wickert et al., 2019) |
| Timekeeping | Temperature-compensated clock with alarm wake-up | Stations must agree in time across a network |
| Sensor power | Switched rail with settling delay | Sensors draw current only while being read |
| Analogue inputs | Ratiometric measurement with reference resistor | Cancels drift of the supply and reference voltage |
| Storage | Plain-text file; card powered only for writing | Readable without special software; avoids card sleep current (Beddows and Mallon, 2018) |
| Telemetry | Optional long-range radio module | Not every site justifies the energy and cost of a link |
| Release | Complete design files under an open licence | Others can build, repair and audit the device (Bonvoisin et al., 2017) |
3.1. Step 1: Write the energy budget first
The designer begins with a single sheet that states the target service interval, the battery chemistry and capacity derated for the lowest expected temperature, and from these the average current that the logger may draw. The allowance is then divided between the sleeping state, which lasts almost all of the time, and the brief active state in which sensors are powered, read and the result stored. For a logger that wakes for a few seconds every quarter of an hour, the sleep current usually decides the outcome, so every component that remains powered during sleep is listed with its quiescent current from the data sheet. A design whose budget cannot be closed on paper will not be rescued in firmware. The sheet is kept as part of the documentation and revised when measured currents become available.
3.2. Step 2: Fix the core architecture
The core consists of a microcontroller, a clock and a power stage. The proposal is to use an eight-bit or low-power thirty-two-bit microcontroller supported by the Arduino tool chain, because that ecosystem is what most field scientists and students can maintain, placed on a purpose-made board with none of the always-on accessories of a development board. The microcontroller spends its life in its deepest sleep mode. It is woken by the alarm output of a temperature-compensated crystal clock with its own backup cell, which also provides the timestamp. A regulator with quiescent current in the microampere range supplies the core, or the core runs directly from the cells where their voltage range permits. A watchdog timer resets the processor if the firmware hangs, since an unattended station that stops silently is the costliest failure in the field (Horowitz and Hill, 2015).
3.3. Step 3: Design the sensor interfaces
Sensors are supplied from a rail that the microcontroller switches on only for the reading, with a programmable settling delay for each sensor type. Three kinds of input are provided. A serial bus conforming to the SDI-12 convention accepts the many commercial hydrological and soil sensors that use it, and the inter-integrated-circuit and one-wire buses accept inexpensive digital temperature, humidity and pressure devices. Analogue inputs are arranged ratiometrically: a resistive sensor such as a thermistor forms a divider with a precision reference resistor, and the converter measures the ratio against the same excitation voltage, so that changes in supply cancel. A counter input with debouncing serves tipping-bucket rain gauges and anemometers and must remain active during sleep. All external lines carry series resistance and transient suppression, because long cables in open country collect induced surges during thunderstorms.
3.4. Step 4: Design the data path
Each record is written as a line of plain text to a removable memory card, with the time in Coordinated Universal Time, the battery voltage and the board temperature alongside the sensor values. Every file opens with a header naming the station, the firmware version, the sensors attached, their units and their calibration coefficients, so that a file separated from its field notes can still be interpreted. The card is powered through a switch and only while writing, records are buffered so that the card is woken as seldom as possible, and the file is closed after every write to limit what a power failure can corrupt.
Telemetry is treated as an option fitted to the same board. A sub-gigahertz long-range radio of the LoRa type suits sparse networks, since it trades data rate for range and its duty cycle can be kept very low (Augustin et al., 2016). The energy budget of the first step is recalculated with the radio included, since one transmission can cost as much as many readings. Local storage is retained even when a link is present, a principle already evident in the early mote platforms (Polastre et al., 2005).
3.5. Step 5: Prepare the release package
A design is open only if someone else can make it. Bonvoisin et al. (2017) examined what open-source hardware projects publish and found that many release less than is needed to reproduce the product. The package proposed here therefore contains the schematic and board layout in the native format of a free design tool as well as in printable form, the manufacturing files, a bill of materials with at least one alternative for each critical part, the firmware with build instructions, enclosure drawings, an assembly guide with photographs, and the test procedure of the next step. Hardware and documentation are released under a recognised open-hardware licence and the firmware under a compatible software licence, following established guidance for such projects (Gibb, 2014; Pearce, 2014).
3.6. Step 6: Plan verification before deployment
The verification plan has a bench part and a field part. On the bench, sleep and active currents are measured with an instrument able to resolve microamperes and compared with the budget. The clock is compared with a reference over several weeks and over the expected temperature range. Each analogue channel is checked with precision resistors and a calibrated voltage source, and the digital buses with the intended sensors on the intended cable lengths. The board is cycled through the temperature range in a chamber while logging. In the field, a small number of units are installed beside a trusted reference logger for at least one full season before the network is committed, with battery voltage recorded throughout so that the endurance estimate can be tested against reality.
4. Fitting the Design to a Network
A network multiplies every small weakness. Three practical matters deserve attention beyond the board itself. Enclosures and connectors fail more often than electronics, and a sealed housing with a desiccant, a pressure-equalising vent and gland-sealed cables is worth more than a refinement to the circuit. Each unit should carry a unique identifier in firmware and on its label, tied to a site register that records location, installation date, sensor serial numbers and every visit. And the people who will maintain the network should be able to assemble and repair a unit themselves, which argues for through-hole or large surface-mount parts where the choice exists and for a design that tolerates substitution. These considerations are organisational more than electronic, and they are the ones that reviews of low-cost networks single out as decisive (Mao et al., 2019).
5. Limitations and What Remains to Be Shown
The design described here is a proposal. It has not been fabricated, programmed or deployed in the course of this work, and nothing in the article should be read as a performance claim. The first thing a validation would need to show is whether the paper energy budget survives contact with real components, whose sleep currents vary between production batches and rise with temperature. The second is long-term timekeeping and data completeness over a season in the field, expressed as the fraction of scheduled records actually recovered. The third is the accuracy of the analogue channels against traceable references across the temperature range.
Some limits are inherent. A logger built from commodity parts depends on components that may be withdrawn or counterfeited, and a published bill of materials ages quickly. Low cost per unit does not mean low cost per data point once assembly time, calibration and site visits are counted, a caution raised by Chan et al. (2021). Open designs also carry no warranty or certification, which restricts their use where measurements have regulatory standing. The method is intended for research and operational screening networks, where transparency and repairability weigh heavily, and not as a replacement for certified instruments in compliance monitoring.
6. Conclusion
The open loggers already in the literature show that a capable instrument can be built from inexpensive parts, and they also show where such instruments usually disappoint. The method proposed here orders the design work so that energy, timing, analogue integrity, data handling and documentation are settled deliberately and in that sequence, with a verification plan written before the first unit goes into the ground. Whether a logger built this way meets its budget and keeps its data through a field season is for a build and trial to establish, and the release package is designed so that any group may carry out that trial and publish the result.
Conflict of interest
To be declared by the author(s) before publication.
Funding
To be declared by the author(s) before publication.