1. Introduction
Most mechanical and product designers meet materials selection through a single picture. Young's modulus is plotted against density on logarithmic scales, metals sit in one corner, polymers in another, foams trail away towards the bottom left, and a sloping guideline picks out the materials that make the lightest stiff beam. The chart was introduced by Ashby (1989) and developed into a full selection method in a textbook now in wide use (Ashby, 2011). Its strength is that it turns a database of thousands of grades into a picture that can be read in a minute, and it attaches to that picture a rule, the material index, that follows from the mechanics of the component.
The same author showed long ago how environmental quantities can be handled in the same way, and has published embodied energy and carbon data for the common engineering materials (Ashby, 2013). Others made similar proposals in the 1990s (Holloway, 1998; Weaver et al., 1996). Yet the chart most engineers reach for when they sketch a bracket, a housing or a frame is still modulus or strength against density, sometimes with cost. Carbon enters later, if at all.
This Perspective argues that the omission is no longer defensible for routine design. It makes the case for a carbon footprint axis on the everyday charts, examines the main objections, and suggests how the axis should be built so that it informs without misleading.
2. How Carbon Is Handled Now
The established instrument for environmental assessment of products is life cycle assessment, standardised in the ISO 14040 series (ISO, 2006a), with a dedicated standard for the carbon footprint of products (ISO, 2018). It is rigorous, and it covers extraction, manufacture, transport, use and disposal. It is also slow, needs an inventory database and trained judgement about system boundaries and allocation, and is usually carried out by a sustainability specialist and not by the person who chooses the material (Hellweg and Milà i Canals, 2014).
The result is a mismatch of timing. Materials are chosen at the concept and embodiment stages, when the designer has a function, a few constraints and an hour to spare. A full assessment requires a bill of materials, which exists only once those choices have been made. By the time a study reports that the housing would have a lower footprint in a different alloy, the tooling has been ordered. Reviews of selection methods describe many formal ranking techniques, yet chart-based screening remains the usual first step (Jahan et al., 2010). Whatever is not on the chart at that first step tends not to influence the shortlist.
3. The Case for a Carbon Axis
The scale of the problem is one reason to act at the first step. The production of materials, chiefly steel, cement, plastics, paper and aluminium, is responsible for a large share of industrial greenhouse gas emissions, and the scope for cutting the energy intensity of those processes is limited by thermodynamics and by how far existing plant has already been optimised (Allwood et al., 2011; Gutowski et al., 2013). Demand-side choices, including which material is specified and how much of it, therefore carry weight, and those choices are made one component at a time by ordinary designers.
The second reason is that the method already exists and costs nothing extra to apply. A material index for minimum mass contains density in the denominator. Multiplying density by the embodied carbon per kilogram gives the embodied carbon per unit volume, and substituting that product for density yields the index for minimum embodied carbon of the same component (Ashby, 2013). Table 1 lists the indices for six standard cases. The mechanics is unchanged. Only the quantity on the horizontal axis differs.
| Component and design limit | Index for minimum mass | Index for minimum embodied carbon |
|---|---|---|
| Tie in tension, stiffness-limited | E / ρ | E / (ρC) |
| Tie in tension, strength-limited | σ / ρ y | σ / (ρC) y |
| Beam in bending, stiffness-limited | 1/2 E / ρ | 1/2 E / (ρC) |
| Beam in bending, strength-limited | 2/3 σ / ρ y | 2/3 σ / (ρC) y |
| Flat panel in bending, stiffness-limited | 1/3 E / ρ | 1/3 E / (ρC) |
| Flat panel in bending, strength-limited | 1/2 σ / ρ y | 1/2 σ / (ρC) y |
The third reason is that the carbon chart tells a different story from the mass chart, and designers should see the difference. Materials that excel per kilogram may carry a large production burden per kilogram, so that the lightest solution is not the lowest in embodied carbon. Primary aluminium, magnesium, titanium and carbon fibre composites all move unfavourably relative to steels, timber and many glass-filled polymers when the axis changes from density to carbon per unit volume. A designer who has only seen the density chart has no reason to suspect this. One who sees both will ask the right question: whether the mass saved pays back the extra carbon over the life of the product.
A fourth reason is cultural. What appears on the standard chart is understood by students to be what matters. Cost was added to the charts because engineers must answer for it. Adding carbon makes the same statement, and places the quantity in front of the person with the most influence over it.
4. Objections and Replies
Four objections are raised against putting carbon on a general-purpose chart. None is trivial.
4.1. The data are too uncertain
Embodied carbon is not a material property in the sense that modulus is. It depends on the ore, the process route, the electricity grid, the recycled content and the boundaries of the study. Compilations such as the inventory assembled by Hammond and Jones (2008) for construction materials report wide ranges for a single material, and background databases differ in method (Wernet et al., 2016). The objection is that plotting such numbers lends them false precision. The reply is that the chart format already represents ranges: each material is a bubble whose size shows the spread of its properties, and the axes are logarithmic. Differences between material classes in carbon per unit volume span more than an order of magnitude, which is larger than the uncertainty within most classes. A screening tool needs to rank classes, and it can do so honestly if the bubbles are drawn at their true width and primary and recycled grades are shown separately.
4.2. The use phase matters more
For vehicles and aircraft, energy consumed in use usually exceeds that embodied in the materials, and a lighter structure in a more carbon-intensive material can give a net saving. Reviews of automotive lightweighting confirm that the outcome depends on the mass saved, the distance driven and the powertrain (Kim and Wallington, 2013). An embodied carbon axis alone would steer such designs the wrong way. This is a reason to pair the axis with the mass index, not to omit it. The method for trading one objective against another through an exchange constant, in this case the life cycle carbon saved per kilogram of mass removed, is well established (Ashby, 2000). For the very large number of products that do not move, such as furniture, enclosures, fixtures, machine frames and building components, embodied carbon is the dominant term and the axis applies directly.
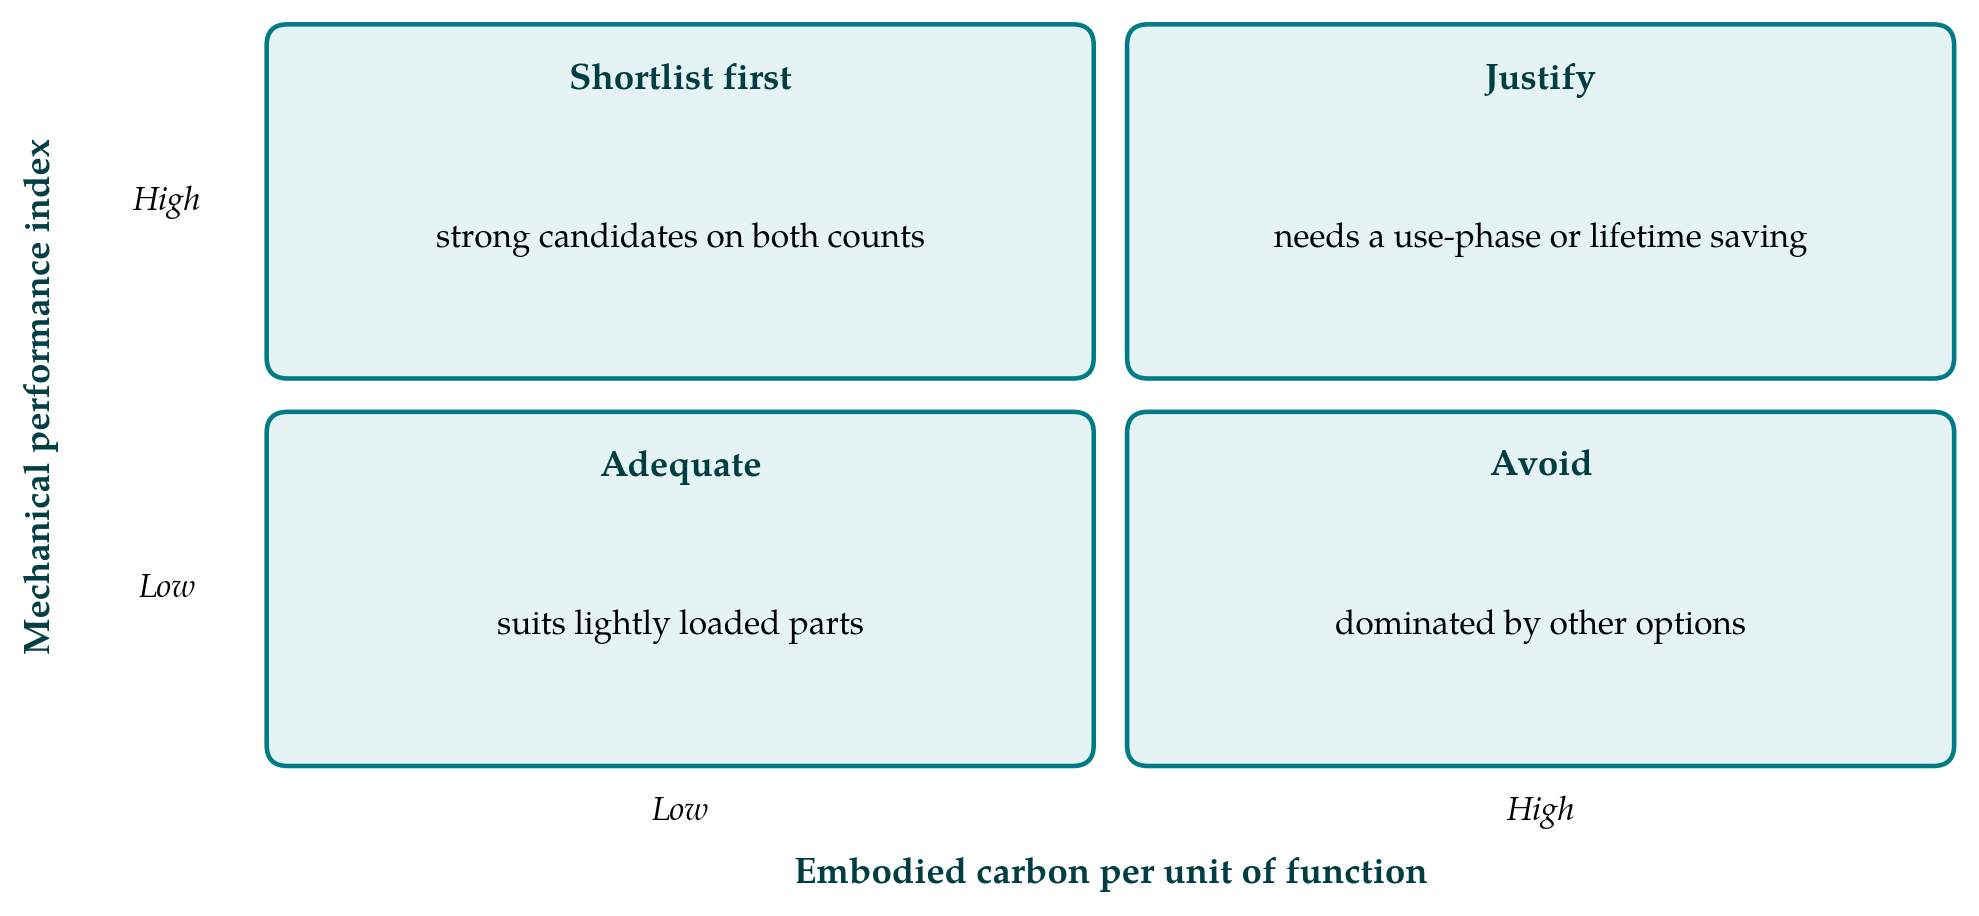
Figure 1 shows how the two measures can be read together. A candidate with high performance and low embodied carbon per unit of function goes on the shortlist at once. A candidate with high performance and high carbon is not excluded, but it carries a burden of justification that the designer must discharge by pointing to a saving elsewhere in the life cycle.
4.3. A single indicator invites burden shifting
Life cycle assessment considers many impact categories because reducing one can raise another. A material with a low carbon footprint may be demanding of water or land, or problematic at end of life. The objection is serious, and the carbon axis should be presented as a screening step that precedes a fuller assessment of the shortlisted options and does not replace it. The same is true of every axis on a selection chart: nobody supposes that a favourable position on the modulus-density chart settles corrosion resistance or weldability. Supporting information, documentation and expert review remain part of the selection procedure (Ashby et al., 2004).
4.4. Substitution is the wrong lever
Allwood and Cullen (2012) argue that the larger opportunities lie in using less material: designing to actual loads, reducing yield losses in manufacture, extending product life and reusing components. A chart that compares materials might distract from these. The point is fair, but the function-based index answers part of it. Because the index is derived for a component that just meets its stiffness or strength requirement, it embodies the idea of using no more material than the function needs. It also makes the benefit of recycled content and of efficient section shapes visible on the same plot. The chart is an entry point to material efficiency and not a rival to it.
5. What the Change Would Require
Three things are needed. Educators would present the carbon chart alongside the density chart from the first course in materials selection, with worked examples in which the two give different answers, and would teach the exchange-constant method for products with a significant use phase. Data providers would publish embodied carbon as ranges with stated boundaries, cradle to gate, distinguishing primary from secondary production. Suppliers would report grade-specific values in environmental product declarations prepared to the relevant standard (ISO, 2006b), so that the generic bubble can be replaced by a point once a supplier is chosen.
Small firms stand to gain most. A company without a sustainability department cannot commission a life cycle study for every bracket, but its designers can read a chart. If that chart carries a carbon axis with honest ranges and a clear note on its limits, the routine decisions that never reach a specialist will at least be made with the information in view.
6. Conclusion
The property chart is where everyday materials decisions begin, and what it omits is easily forgotten. Embodied carbon per unit of function can be placed on it by a change of axis that leaves the underlying mechanics intact. The objections concerning data quality, use-phase effects, other impacts and material efficiency are reasons to construct and label the axis with care, pairing it with the mass index and treating it as a screen. They are not reasons to leave designers without it.
Conflict of interest
To be declared by the author(s) before publication.
Funding
To be declared by the author(s) before publication.