1. Introduction
A smartphone, a server board or an automotive control unit is assembled from several hundred to several thousand parts, and the supply base behind those parts is concentrated in East and Southeast Asia. Wafers are fabricated in one country, packaged and tested in another, mounted on boards in a third and shipped to final assembly in a fourth. Nearly all of the heavier and cheaper items, and a good share of the rest, move by container ship. The gateway ports of southern China, the Yangtze delta, Taiwan, South Korea, Singapore, California and north-west Europe are therefore shared infrastructure for the whole industry.
Ports stop working for many reasons. Labour disputes closed the West Coast ports of the United States in 2002 and slowed them again in later contract rounds. Public health controls shut terminals at Yantian and Ningbo in 2021, typhoons close the Pearl River delta ports most summers, and the grounding of a container ship in the Suez Canal in March 2021 showed that a blocked route has much the same effect as a blocked port. Cyber incidents at terminal operators and carriers have been added to the list.
The stock answer to supply risk is diversification: qualify a second supplier, split the volume, and a problem at one source becomes a problem for part of the flow only. The answer is intuitive and is repeated in most practitioner guidance (Chopra and Sodhi, 2004; Sheffi, 2005). Whether it holds for port disruptions in particular is less obvious, because a port is a common point through which several suppliers may ship. This article reviews what the literature says on that question and on the speed of recovery, as distinct from the avoidance of loss.
2. Scope and Approach
This is a narrative review of the published literature. It draws on four strands that are seldom read together: operations research models of sourcing under supply risk, the conceptual and survey-based literature on supply chain resilience, econometric studies of how disruptions propagate between firms, and maritime and regional economics work on port closures. Sources were chosen for their influence on later work and their relevance to the question, with no claim to exhaustive coverage. Electronics is the focus throughout, though much of the best evidence comes from neighbouring sectors such as automotive, and is read here for what it implies about component supply. Table 1 summarises the strands and what each contributes.
| Strand | Central question | Implication for port disruptions | Representative sources |
|---|---|---|---|
| Sourcing models | When does a second source pay? | Value falls as supplier failures become correlated | Tomlin, 2006; Dada et al., 2007 |
| Resilience frameworks | Which capabilities shorten recovery? | Redundancy and flexibility both matter; visibility comes first | Christopher and Peck, 2004; Pettit et al., 2010 |
| Disruption severity | What makes a disruption severe? | Density and node criticality raise severity | Craighead et al., 2007 |
| Network propagation | How do shocks spread between firms? | Specific inputs transmit shocks; dispersed partners aid recovery | Barrot and Sauvagnat, 2016; Todo et al., 2015 |
| Port economics | What does a closure cost, and to whom? | Rerouting and inventories absorb much of a short closure | Hall, 2004; Rose and Wei, 2013 |
| Risk exposure metrics | Where is the chain most exposed? | Compare time to recover with time to survive at each node | Simchi-Levi et al., 2015 |
3. What Diversification Means for an Electronic Component
The term covers several different things. A buyer may hold two approved suppliers for a part and split orders between them, which is dual sourcing in the strict sense. It may buy from one supplier that makes the part in two plants. It may keep a second supplier qualified but dormant, to be activated in an emergency. Or it may simply buy standard parts through distributors who themselves draw on several makers. The early comparison of single and multiple sourcing by Treleven and Schweikhart (1988) already separated the risks these arrangements address: disruption of supply, price escalation, quality and technology access.
Electronics adds two complications. Many of the parts that matter most are custom: an application-specific integrated circuit, a display panel, a camera module built to one product's dimensions. Qualifying a second maker for such a part takes months and engineering effort, and for the most advanced semiconductors there may be no second maker at all. The other complication is depth. A buyer with two board assemblers may find that both buy the same capacitor from the same factory. Choi and Krause (2006) describe the supply base in terms of the number of suppliers, their differentiation and their interrelationships, and argue that reducing or enlarging it changes risk in ways a simple supplier count does not capture.
4. What the Sourcing Models Predict
Analytical work treats diversification as one of several ways to manage an unreliable source. Tomlin (2006) compares mitigation tactics, which are paid for in advance, such as inventory and routine dual sourcing, with contingency tactics that are invoked only after a disruption, such as rerouting or asking a reliable supplier to raise output. The preferred mix depends on how often disruptions occur, how long they last and how quickly the back-up supplier can add volume. Long, rare disruptions favour a second source over inventory, because stock sized for a long outage is expensive to carry for years.
Models with several unreliable suppliers reach a consistent conclusion about correlation. In the newsvendor setting of Dada et al. (2007), cost generally takes precedence over reliability when suppliers are selected, and reliability affects how much is ordered from those chosen. Babich et al. (2007) show that when supplier defaults are correlated the insurance value of a second source shrinks, although competition between the suppliers may still lower prices. The lesson carries over directly: two suppliers that ship from the same port have highly correlated delivery failures during a closure, whatever their independence as businesses.
A third line of modelling looks below the first tier. Ang et al. (2017) study a manufacturer with two first-tier suppliers who may share a second-tier source, and show that the manufacturer's best sourcing strategy depends on that overlap, which it often cannot observe. The broader review by Tang (2006) observes that most models assume the buyer knows the failure probabilities and how they depend on one another, an assumption that fits port risk poorly.
5. Port Disruptions as a Distinct Kind of Shock
A fire in a supplier's plant removes capacity. A port closure removes nothing: the factories keep producing and the goods accumulate on the wrong side of the quay. This has three consequences for recovery. The shock is common to every shipper using the port, so competitors and other suppliers are hit together and alternative capacity on air freight or through neighbouring ports is bid for by all of them at once. Recovery of the port is not recovery of the flow, because the backlog of vessels and containers takes far longer to clear than the closure lasted and liner schedules stay unreliable for weeks (Notteboom, 2006). And goods already in transit are a buffer that a plant fire does not provide.
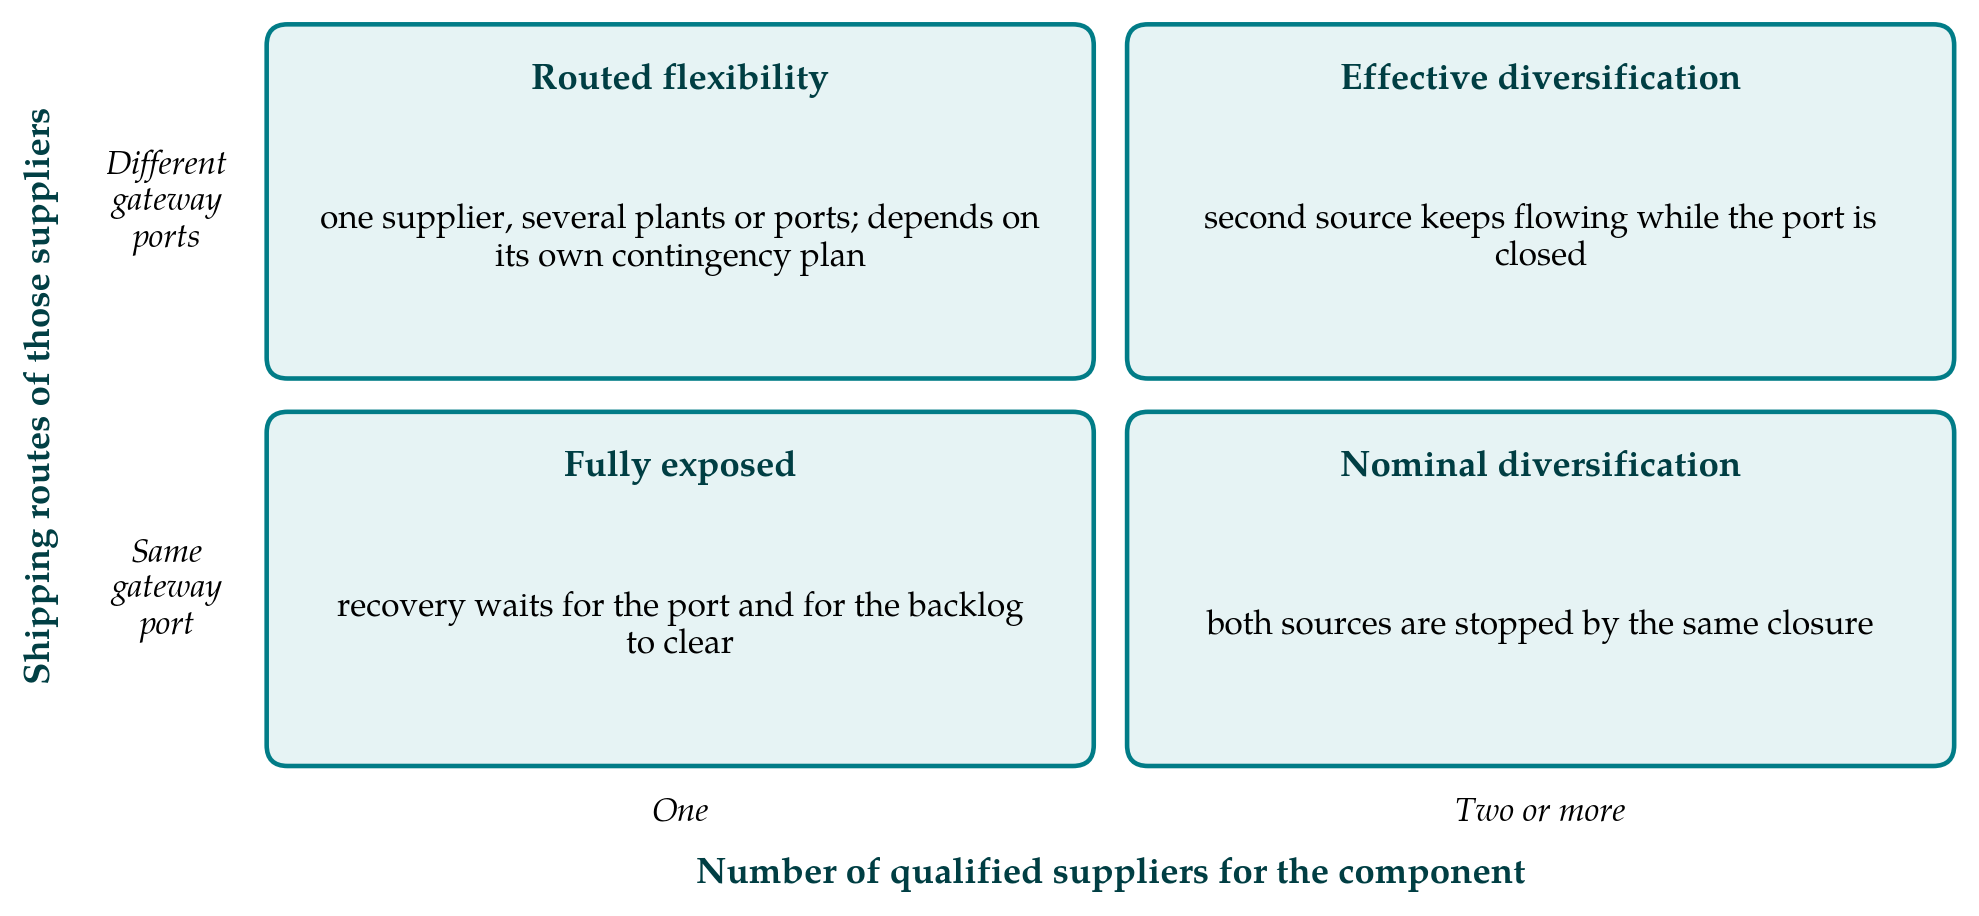
Craighead et al. (2007) relate the severity of a disruption to the density of the supply chain, its complexity and the criticality of the affected node, and to the firm's capabilities for warning and recovery. A gateway port scores high on density and criticality by construction. Figure 1 sets out the resulting distinction between having several suppliers and having several routes. Only the upper right cell offers protection that does not depend on a contingency plan being improvised under pressure.
The economics literature on port closures supports a cautious reading of headline loss figures. Hall (2004) examined the impact studies published around the 2002 West Coast lockout and argued that they overstated losses by ignoring the ways shippers adapt. Rose and Wei (2013) build the adaptations into an input-output analysis of a port shutdown: ship rerouting, use of inventories, diversion of exports to other uses and rescheduling of production. They find that such measures offset a large share of the potential loss. The adaptations they list are forms of flexibility. Supplier diversification appears only indirectly, through the ability to draw on inputs that do not pass through the closed port.
6. Empirical Evidence on Recovery
No body of studies measures recovery speed after port closures for electronics firms with and without diversified suppliers. The evidence has to be assembled from studies of other shocks and other outcomes, and it should be read with that limitation in view.
6.1. Evidence from natural disasters and plant failures
The best documented single episode in electronics is the fire at a semiconductor plant in New Mexico in 2000, which supplied radio-frequency chips to two handset makers. The account by Norrman and Jansson (2004) describes how one of them, having no alternative source for the affected parts, suffered a large loss and subsequently rebuilt its risk management process around mapping of sub-suppliers. The episode is usually told as a lesson in speed of response, yet the underlying asymmetry was one of sourcing: the firm that recovered quickly could shift demand to other plants and suppliers.
The Great East Japan Earthquake of 2011 produced the most rigorous evidence. Todo et al. (2015) found that firms in the affected area with suppliers and customers outside it resumed operations sooner, which they attribute to support and substitution from intact partners, while dependence on partners inside the area delayed recovery. Carvalho et al. (2021) traced the shock through the national firm network and showed losses reaching firms several links away from the damage. Barrot and Sauvagnat (2016), using natural disasters in the United States, found that customers of a struck supplier lose sales chiefly when the input is specific, and that the loss spills over to the customer's other suppliers. The floods in Thailand in the same year closed a large share of the world's hard disk drive capacity at once and are a reminder that several suppliers in one river basin are one risk (Haraguchi and Lall, 2015).
6.2. Evidence on complexity and its costs
Diversification is not free of risk of its own. Bode and Wagner (2015) find that horizontal, vertical and spatial complexity of the upstream chain each raise the frequency of disruptions a firm experiences, and that the three amplify one another. More suppliers in more places mean more things that can go wrong, and more ports in use. The financial stakes are large either way: Hendricks and Singhal (2005) documented substantial and lasting underperformance in the share prices of firms that announced supply chain disruptions, with no quick rebound.
7. Conditions Under Which Diversification Speeds Recovery
Read together, the strands point to conditions and not to a general rule. The first is route independence: the alternative source must reach the buyer without passing through the affected gateway, or must be able to switch mode. The second is readiness. A supplier that is approved on paper but has never run volume cannot fill a gap within the weeks that matter, which is why Sheffi and Rice (2005) stress that redundancy must be paired with flexibility that is exercised in normal times. The third is spare capacity at the alternative source at the moment when every other buyer is asking for it.
Electronics has one advantage over most sectors in meeting these conditions. Many components are small and valuable in relation to their weight, so that air freight, ruinous for steel or furniture, is a tolerable emergency measure for integrated circuits and modules. A second source reachable by air, or a primary source able to switch mode, can therefore stand in for route independence by sea for part of the bill of materials. The advantage does not extend to bulky, low-value items such as enclosures, packaging and passive components bought by the reel, and a finished product cannot ship without them. Recovery is set by the slowest part to arrive.
The fourth condition is knowledge. The exposure measures developed by Simchi-Levi et al. (2015) compare, for each node, the time it would take to recover with the time the buyer could survive on stock and alternatives. Their application to an automotive supply chain showed that large exposures can sit with inexpensive parts from suppliers that receive little management attention. Applying the same logic to ports requires knowing which gateway each part uses, a fact rarely held in procurement records. Resilience frameworks have long listed visibility beside redundancy for this reason (Christopher and Peck, 2004; Pettit et al., 2010).
8. Gaps and Directions for Research
The clearest gap is direct measurement. Customs and bill-of-lading records identify the port of loading for individual shipments and could be joined to firm-level output or sales to compare recovery paths after a dated closure. The research design of the earthquake studies is transferable, with the port closure as the shock and the pre-existing spread of a firm's suppliers across gateways as the source of variation. Until such work is done, statements about recovery speed rest on analogy.
Three further questions follow. One is how diversification compares with its substitutes for port risk specifically: buffer stock held on the destination side, standing air freight arrangements and contractual rights to reroute. A second concerns systemic effects. If every electronics firm adds a second source in the same alternative region, the industry has moved its common exposure and not removed it, a point raised in the discussion of intertwined supply networks by Ivanov and Dolgui (2020). The third is cost: the recurring expense of qualification, split volumes and added complexity is seldom set against the infrequent benefit in a form that managers can use when budgets are decided.
9. Conclusion
The literature gives qualified support to the view that supplier diversification shortens recovery after a port disruption. Models establish that a second source is valuable to the extent that its failures are independent of the first, and studies of earthquakes and fires show that geographically separate partners help firms restart. The same work shows that the number of approved suppliers is a poor guide: what matters is whether the alternatives use different gateways, are ready to run, have capacity to spare, and are known to the buyer down to the lower tiers. For electronics, where critical parts are specific and production is regionally clustered, those conditions are demanding. Direct evidence on port closures remains to be gathered.
Conflict of interest
To be declared by the author(s) before publication.
Funding
To be declared by the author(s) before publication.