1. Introduction
Octopus is among the few reef resources of the Western Indian Ocean with a ready export market, and in many villages it is the main source of cash for households that glean the reef flat at spring low tides. The fishery is simple in its technology. Fishers, many of them women, walk or snorkel over the flat and take octopus from their dens with a spear or a metal rod; divers work the reef edge. The catch is sold the same day to collectors who supply exporters. The artisanal fishery in Tanzania was described in these terms by Guard and Mgaya (2002), and a recent global review places the region among the significant sources of octopus from small-scale fisheries (Sauer et al., 2021).
In south-west Madagascar, the village of Andavadoaka closed part of its octopus ground for several months in 2004 and reported larger animals and heavier landings when it reopened (Humber et al., 2006). Neighbouring villages followed, and the closures became the foundation of the Velondriake locally managed marine area (Harris, 2007). Locally managed areas using similar measures now exist in several countries of the region (Rocliffe et al., 2014).
The published evaluations from Madagascar are encouraging (Benbow et al., 2014; Oliver et al., 2015), but most closures elsewhere are judged by the size of the opening day catch alone. That measure is persuasive to those present and weak as evidence. This article proposes a framework for a more defensible assessment that remains within the means of a community organisation. It describes a method and does not report an evaluation.
2. Background
Two bodies of knowledge shape the framework: the life history of the target species and the experience of evaluating periodic closures in small-scale fisheries.
2.1. Why short closures can work for octopus
Octopus cyanea, the day octopus, is short lived and grows very quickly. Rearing studies established that an animal passes from settlement to maturity and death in about a year (Van Heukelem, 1973), and age readings from wild animals confirmed a brief life span with rapid, variable growth (Herwig et al., 2012). An octopus left undisturbed for two or three months can therefore gain substantially in weight. In south-west Madagascar the species spawns through the year with seasonal peaks, and females mature at a large size (Raberinary and Benbow, 2012), so the timing of a closure relative to recruitment and spawning affects what it can achieve.
2.2. What earlier evaluations found and where they were limited
Benbow et al. (2014) examined the early closures and concluded that benefits were clearer when villages closed their sites at the same time, since a lone closure attracted fishers from the whole area on opening day. Oliver et al. (2015) analysed landings records for a long series of closures, compared the month after opening with a baseline period before closing, and used unclosed sites as controls. They reported increases in landings and in catch per fisher-day at closure sites that were not matched at the controls, and estimated that villages recovered more in income than they had given up. These studies depended on a landings monitoring system that had been running for years, which most communities lack.
Research on periodically harvested closures in the Pacific gives reason for care. Such closures can yield a pulse of catch, but the gain may be exhausted quickly if harvests at opening are intense, and the long-term result depends on the balance between the length of closure and the pressure applied afterwards (Cohen and Foale, 2013; Goetze et al., 2018). An evaluation must therefore look beyond the first day.
3. The Proposed Framework
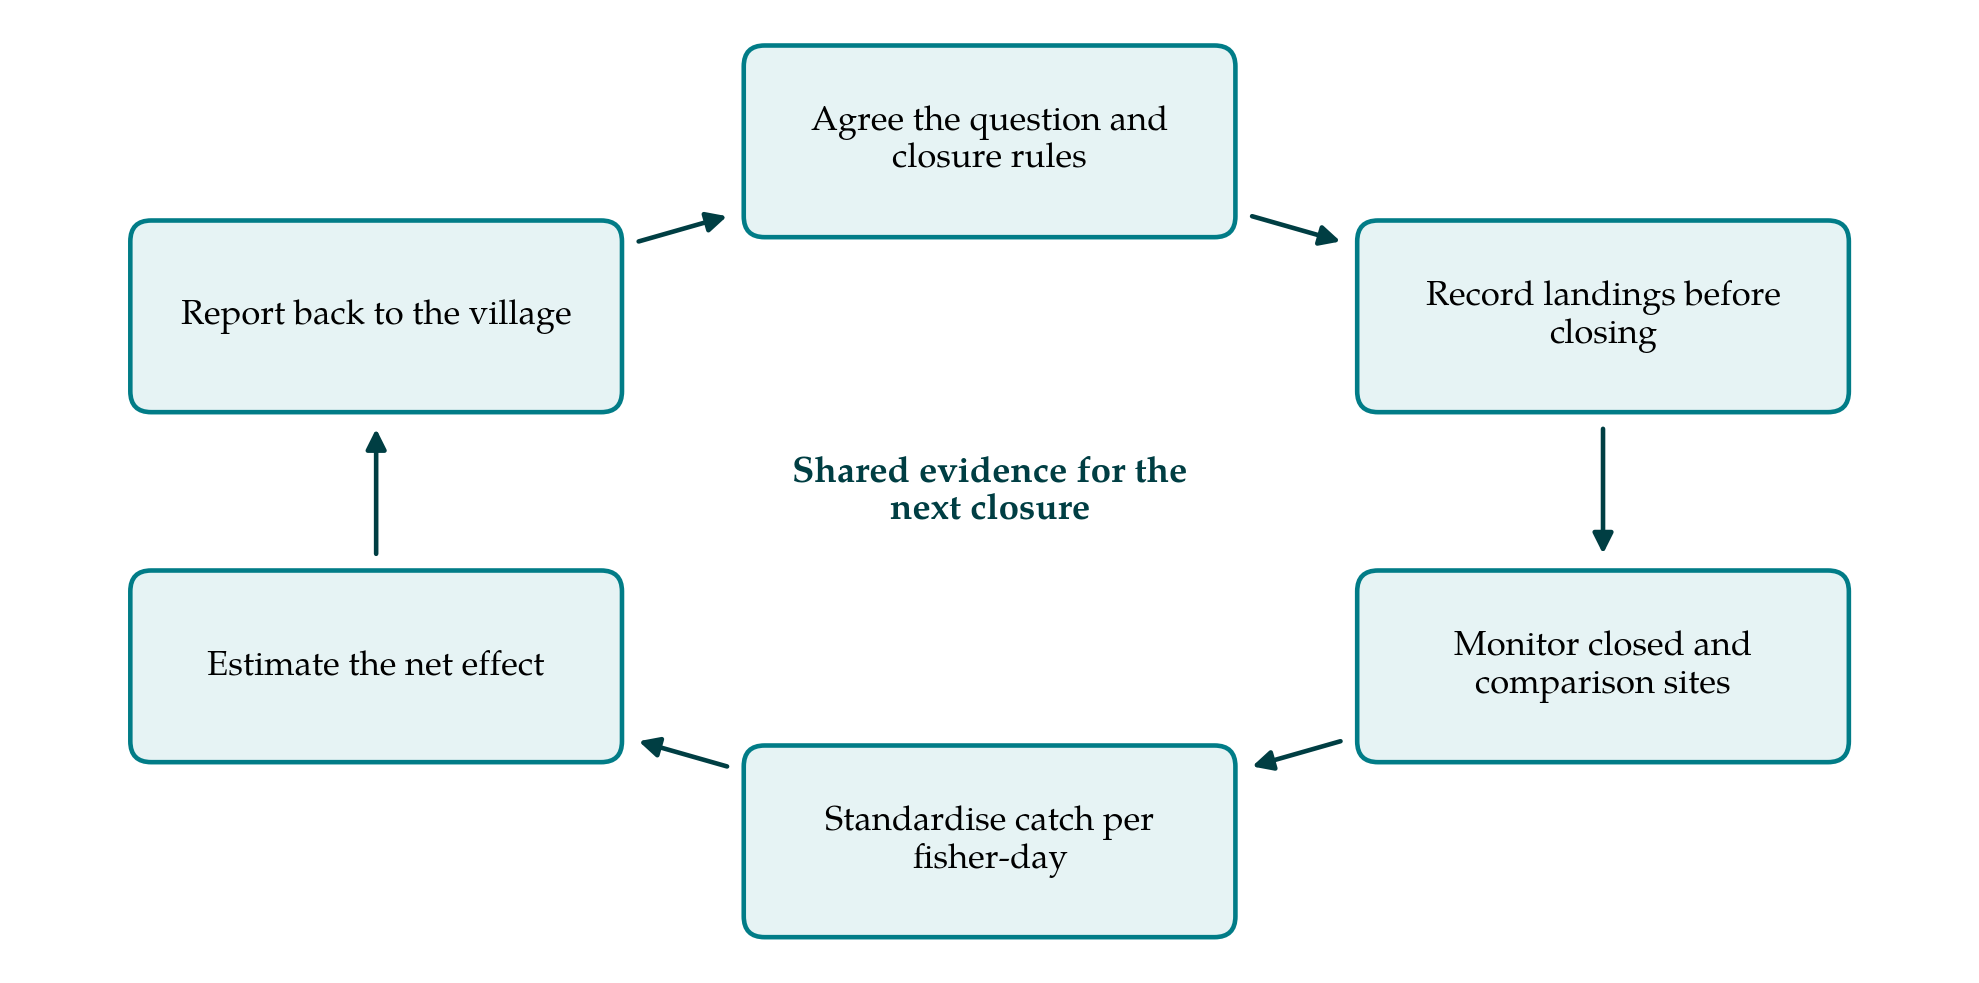
The framework has six components. They are listed with their outputs in Table 1, and Figure 1 shows how they form a loop in which each evaluation informs the design of the next closure. The components are described in order.
| Component | What is done | Output |
|---|---|---|
| 1. Counterfactual | State what catch would have been without the closure and how it will be estimated | Written evaluation question |
| 2. Closure description | Record site, area, dates, rules, enforcement and breaches | Closure record sheet |
| 3. Comparison sites | Choose open grounds with similar habitat, fishers and buyers | List of paired sites with reasons |
| 4. Landings monitoring | Record every fishing trip at the landing point before, during and after | Trip-level landings database |
| 5. Standardisation | Adjust catch per fisher-day for tide, season, gear and fisher | Standardised catch-rate series |
| 6. Net effect | Compare change at closed and open sites; subtract catch forgone | Estimate with uncertainty; who gained |
3.1. Component 1: State the counterfactual
An impact is the difference between what happened and what would have happened otherwise, and the second quantity is never observed (Ferraro, 2009). The evaluation should begin by writing down the question in that form. For a village the relevant question is usually whether total octopus income over the whole period, including the closed months, was higher than it would have been with the ground left open. A secondary question is whether catch rates at the site stayed above their earlier level for more than a few tides after opening.
3.2. Component 2: Describe the closure
Closures differ in ways that determine their effect: the share of the village ground closed, the duration, the season, whether neighbouring villages closed at the same time, and whether the rules were kept. Poaching during the closed period and the number of outside fishers present on opening day should be recorded as carefully as catch. Institutional detail belongs here too, since the durability of community rules depends on clear boundaries, monitoring by the users and graduated sanctions (Ostrom, 1990).
3.3. Component 3: Choose comparison sites
Without a comparison, a rise in catch after opening cannot be separated from a good recruitment year or a seasonal upturn. The framework adopts the logic of before-after-control-impact designs developed for environmental assessment (Stewart-Oaten et al., 1986). Because any single control site may differ from the closure site by chance, several comparison sites are preferable to one (Underwood, 1992). They should have similar reef-flat habitat, be fished by similar gear and sell to the same buyers, and they should lie far enough away that fishers displaced by the closure do not simply move onto them, which would depress their catch rates and exaggerate the apparent benefit.
3.4. Component 4: Monitor landings
Data are collected at the landing point or the buying station by a trained resident. For each fishing trip the record holds the date, the fisher, the gear or method, the ground fished, the time spent, and the number and total weight of octopus; individual weights and sex are taken from a subsample. Recording starts at least two to three months before the closure, continues at comparison sites throughout, and runs for at least three months after opening. Days with no fishing are entered as such, since effort is half of the calculation. Buyers' purchase books provide an independent check on totals.
3.5. Component 5: Standardise catch and effort
Raw catch per fisher-day is affected by much besides abundance. Gleaning is possible only on spring low tides, divers and gleaners differ in catching power, and experienced fishers catch more. Standard practice in fisheries science is to model catch rate as a function of such factors and to read the abundance signal from the remaining time effect (Maunder and Punt, 2004). For closure data a generalised linear mixed model with terms for tidal phase, month, method and site, and a random effect for the individual fisher, is a suitable starting point. Mean individual weight should be analysed separately from numbers caught, because a closure of a few months is expected to act mainly through growth.
3.6. Component 6: Estimate the net effect and who receives it
The effect of the closure is estimated as the change in standardised catch rate at the closed site from before to after, less the corresponding change at the comparison sites. Three further calculations turn this into something a village can use. Total landings and value in the weeks after opening are compared with the baseline. The catch forgone during the closed months, estimated from baseline rates and from effort displaced to other grounds, is subtracted. And the decay of catch rates after opening is plotted, to show whether the gain lasted beyond the first tides.
Distribution deserves equal attention. Opening days favour those who can be present and who fish fastest, and divers may take a large share before gleaners reach the ground. The landings record allows the gain to be broken down by method, by sex of the fisher and by resident or visitor. A closure that raises the village total while shifting catch from women gleaners to visiting divers has not succeeded on the terms most communities would set.
4. Fitting the Framework to Practice
The framework is deliberately modest in its demands. The monitoring form fits on one page, and the data can be held in a spreadsheet. The statistical modelling in Component 5 requires some training or a partner institution; where neither is available, a simpler comparison of median catch per fisher-day on matched spring tides before and after, at closed and open sites, preserves the logic. Results should be returned to the village assembly promptly and in a form that can be discussed, for example as charts of catch per fisher on successive tides, since the purpose is to inform the next decision on where, when and for how long to close.
5. Limitations and What Remains to Be Shown
The framework is a proposal and has not been tested here. Several weaknesses are foreseeable. Good comparison sites are scarce where closures are popular, because most suitable grounds are either closed in rotation or receive displaced effort. A single closure gives one before-after contrast, and confidence comes only from repetition over years. Landings data describe the catch and not the population, so a rise in catch rate could reflect animals moving in from surrounding reef as well as growth in place. And recruitment in a species with planktonic larvae and a one-year life cycle is variable enough to mask a real effect in any one season.
What would need to be shown is that the framework, applied by community monitors with limited support, yields estimates close to those from a fuller analysis of the same fishery, and that villages find the results usable. A trial alongside an existing long-term monitoring programme would be the natural test.
6. Conclusion
Temporary octopus closures are popular because their results can be seen on the beach. The framework proposed here asks for somewhat more: a stated counterfactual, comparison sites, trip-level landings records, standardised catch rates and an account of who gained. These additions are within reach of community organisations and would allow closures to be judged, compared and improved on the basis of evidence that outsiders can also examine.
Conflict of interest
To be declared by the author(s) before publication.
Funding
To be declared by the author(s) before publication.