1. Introduction
Cross-linked polyethylene (XLPE) has been the standard insulation for medium-voltage and high-voltage cables for several decades, and a large share of the installed population is now old enough for condition to matter more than design. Partial discharge (PD), a localised breakdown that bridges only part of the insulation, is both a symptom and an agent of degradation in polymers (Dissado and Fothergill, 1992), and its detection is the most widely used electrical diagnostic for cable systems (Stone, 2005). The reference method, IEC 60270, quantifies each pulse by its apparent charge and relates it to the phase of the applied voltage (IEC, 2000).
Diagnostic practice has grown up around sinusoidal voltage. The recognition of defect types from phase-resolved patterns, formalised by Gulski and Kreuger (1992), assumes that phase is a proxy for instantaneous voltage and its rate of change. Service voltages now depart from that assumption. Power electronic converters inject harmonic currents, and the capacitance of long cable circuits can resonate with network inductance to magnify particular orders; recommended limits such as those of IEEE Std 519 bound the distortion at the point of common coupling but do not remove it (IEEE, 2014). This note considers what harmonic voltage does to PD signatures in aged XLPE cable and what follows for those who interpret them.
2. How Distortion Changes Discharge Behaviour
A discharge occurs in a gas-filled void when two conditions are met: the field across the void exceeds the inception value, and a free electron is available to start the avalanche. After each event, charge deposited on the void walls opposes the applied field, and the next discharge must wait until the external voltage has changed enough to restore the inception condition. This description, developed quantitatively by Niemeyer (1995), makes the timing of discharges depend on the instantaneous voltage and on its slope, and their number per cycle on the total voltage excursion.
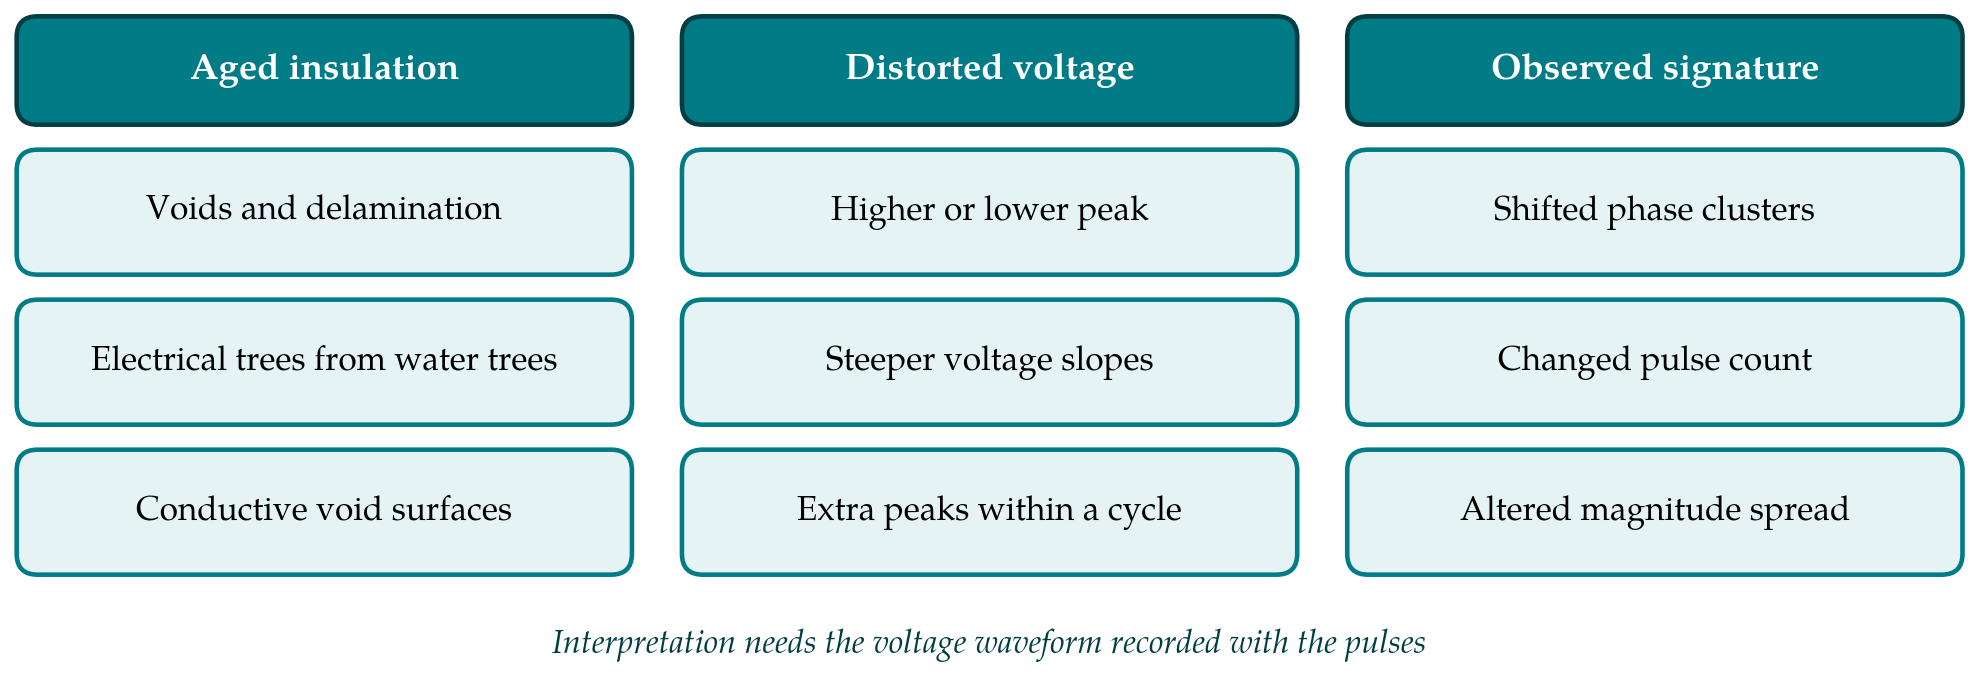
Harmonics alter each of these quantities. Depending on its order and phase angle, a harmonic may raise or flatten the peak of the waveform, steepen or relax its slopes, and, at sufficient amplitude, create additional local maxima and minima within one fundamental period. A raised peak brings voids above inception that were quiet under a sinusoid of the same root-mean-square value. Steeper slopes shorten the recovery interval and raise the pulse repetition rate. Additional extrema split the familiar clusters of the phase-resolved pattern into several groups. Figure 1 sets these voltage features beside the insulation defects on which they act and the changes in signature that result. Florkowski and Florkowska (2006) showed how markedly phase-resolved images are distorted when harmonics are present in the test voltage.
3. What Ageing Adds
A new, well-made XLPE cable should be free of detectable PD at service voltage. Discharge sources appear with age: voids and delamination at the interfaces with the semiconducting screens after repeated thermal cycling, defects in joints and terminations, and electrical trees, which in wet environments may grow from water trees. Water trees themselves do not produce measurable PD, so their presence is revealed only once conversion to an electrical tree has begun (Densley, 2001). An aged cable is therefore one in which the number of potential discharge sites, and the spread of their inception voltages, has increased.
Two consequences follow under harmonic stress. First, a broader population of sites with inception levels near the service voltage means that a modest increase in peak value activates additional sources, so the signature of an aged cable is more sensitive to waveform shape than that of a cable with a single well-defined defect. Second, the discharge process itself changes with time. By-products of discharge raise the surface conductivity of void walls and shift the discharge from a streamer-like to a more diffuse mechanism with smaller, more frequent pulses (Morshuis, 2005). The pattern from an aged void under distorted voltage is thus the product of two departures from the textbook case, and neither can be read without the other.
Harmonics also bear on the rate of ageing. Life tests on cable and capacitor materials under non-sinusoidal voltage, reported by Montanari and Fabiani (1999), identified the peak value of the waveform as the most influential factor, ahead of its root-mean-square value and its slope. The observation is consistent with the account above, since the peak governs whether discharges incept at all.
4. Consequences for Reading Signatures
The diagnostic risk is misclassification. Pattern features that an analyst or an automated classifier associates with defect type, such as the phase span of a cluster, its asymmetry between half-cycles and the shape of its envelope, are altered by waveform distortion in ways that can imitate a different source. Table 1 lists the main effects and the error each invites. Classification schemes built on pulse-shape features, which separate sources before the phase pattern is examined (Cavallini et al., 2003), are less exposed to this risk, because pulse shape depends mainly on the source and the propagation path and not on the phase reference.
| Waveform feature | Effect on the signature | Possible misreading |
|---|---|---|
| Raised peak value | More sites active; larger maximum apparent charge | Severity overstated relative to a sinusoidal reference |
| Flattened peak | Fewer sites active at the same r.m.s. voltage | A real defect goes undetected |
| Steeper slopes | Higher repetition rate; narrower phase clusters | Taken as progression of the defect |
| Additional maxima per cycle | Clusters split into several groups | Taken as multiple independent sources |
| Shifted zero crossings | Clusters displaced along the phase axis | Internal void confused with surface or corona discharge |
| Distortion varying with load | Pattern changes from hour to hour | Trend attributed to insulation change |
Trending is affected as much as classification. On-line monitoring compares present activity with past activity, and harmonic content on a feeder varies with the loads and generators connected. A change in PD level between two readings may reflect a change in the voltage waveform and no change in the insulation. Conversely, off-line tests with a clean sinusoidal or alternative voltage source (IEEE, 2006) may show less activity than the cable experiences in service.
5. Suggestions for Measurement Practice
Several inexpensive precautions follow from the argument. The voltage waveform should be recorded synchronously with the PD data and stored with it, not reduced to a zero-crossing reference. Patterns can then be plotted against instantaneous voltage and its derivative as well as against phase, which removes much of the apparent change caused by distortion. Harmonic spectra should accompany every on-line trend so that readings taken under similar waveforms are compared with one another. Where an off-line result is used to judge fitness for a feeder known to carry substantial distortion, the peak value of the service waveform, not its root-mean-square value, is the better basis for choosing the test level. These are suggestions derived from the literature and would benefit from systematic experimental confirmation on service-aged cable.
6. Conclusion
Harmonic voltage changes when, how often and how strongly partial discharges occur, and the established physics of void discharge explains why. In aged XLPE cable, where discharge sites are more numerous and their behaviour has already drifted from the textbook case, the resulting signatures can mislead both classification and trending if they are read against an assumed sinusoid. Recording the actual voltage with the discharge data is the simplest safeguard. Controlled studies on service-aged cable under defined harmonic content, and interpretation rules that take waveform shape as an input, are the evident next steps.
Conflict of interest
To be declared by the author(s) before publication.
Funding
To be declared by the author(s) before publication.