1. Introduction
Cancer genomes were long assumed to reach their disordered state by increments, one lesion at a time over many cell generations (Stratton et al., 2009). That picture was revised when Stephens et al. (2011) reported tumors in which tens to hundreds of rearrangements were confined to a single chromosome or chromosome arm, with copy number switching back and forth between only two states. They argued that such a configuration is very unlikely to arise by sequential events and named the process chromothripsis, from the Greek for chromosome and shattering. The idea of a one-off catastrophe has since been supported by direct experiment and by surveys of thousands of tumors.
The topic has particular weight in pediatric oncology. Tumors of childhood have low burdens of point mutation, and large sequencing efforts have shown that structural variants and copy number changes account for a large share of their driver events (Gröbner et al., 2018; Ma et al., 2018). A mechanism that can delete tumor suppressors, amplify oncogenes and create fusion genes in one step is therefore of direct interest, both for understanding how these tumors begin and for the practical business of classifying them.
Almost everything known about chromothripsis in children comes from short-read whole-genome sequencing or, before that, from single-nucleotide polymorphism arrays. Optical genome mapping is a different kind of instrument. It does not read bases. It records the positions of fluorescent labels along very long single DNA molecules and infers structure from the label pattern. Because it is now used as a routine assay in cytogenetic laboratories, the question of how well it reveals a chromothripsis signature has become a practical one. This review addresses that question for the solid tumors of childhood.
2. Scope and Approach
This is a narrative review of the published literature. It draws on the original descriptions of chromothripsis and related phenomena, on the mechanistic studies that followed, on genome-wide studies of pediatric tumors, and on technical and validation papers concerning optical genome mapping. No formal search protocol was applied and no pooled estimates are offered. The aim is to connect two bodies of work that have developed largely apart, and to say plainly where the evidence for their combination is strong, where it is indirect and where it is missing.
3. Chromothripsis and Its Relatives
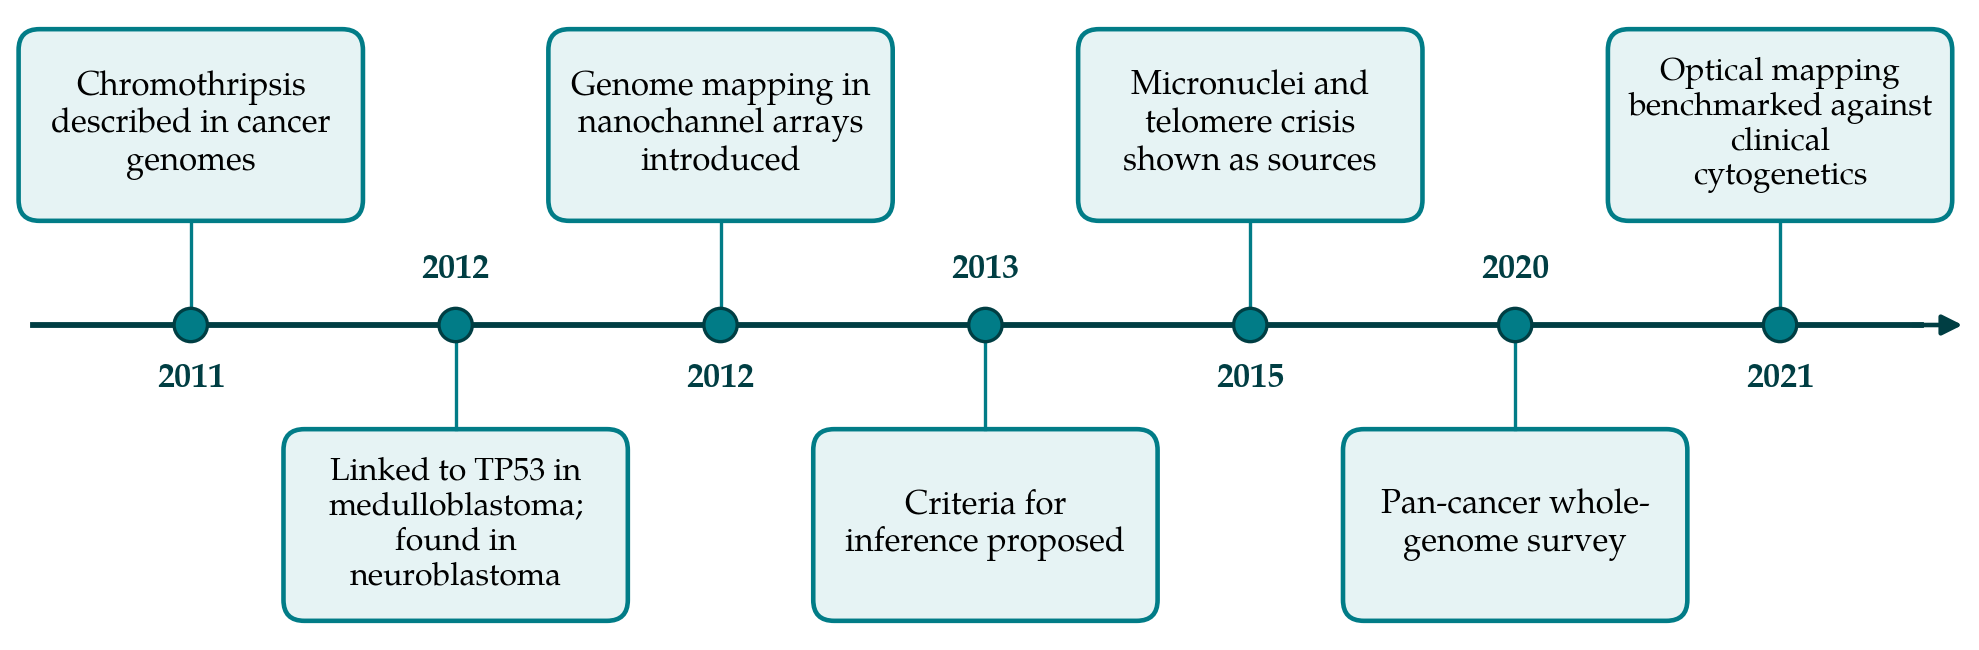
Chromothripsis is one member of a family of complex rearrangements for which Holland and Cleveland (2012) proposed the collective term chromoanagenesis. The family matters here because its members leave different traces, and a method that sees only part of the trace may confuse them. Figure 1 places the main findings discussed in this review in order of publication.
3.1. How a chromosome comes to be shattered
Two cellular routes are well supported. In the first, a chromosome that lags at anaphase is enclosed in a micronucleus, where replication is defective and the envelope is prone to rupture. Crasta et al. (2012) showed that chromosomes in micronuclei undergo extensive breakage, and Zhang et al. (2015), by imaging single cells and then sequencing their daughters, showed that the missegregated chromosome alone acquires rearrangements with the hallmarks of chromothripsis. In the second route, telomere crisis produces dicentric chromosomes that form bridges between daughter nuclei; resolution of the bridge fragments the chromosome and can be accompanied by clustered point mutation (Maciejowski et al., 2015). The two routes are connected, since a broken bridge chromosome may itself missegregate into a micronucleus at the next division (Umbreit et al., 2020). The fragments are then rejoined largely by end joining, with little or no homology at the junctions.
Two related processes need to be told apart from chromothripsis. Chromoanasynthesis arises from replication errors, with serial template switching that generates copy gains, including duplications and triplications, and junctions marked by microhomology (Liu et al., 2011). Chromoplexy consists of chains of rearrangements that link several chromosomes with little copy number change, first characterized in prostate cancer (Baca et al., 2013). Chromothripsis is also not confined to tumors: it was identified in the germline of individuals with congenital disorders soon after its discovery in cancer (Kloosterman et al., 2011).
3.2. The criteria for calling it
Because a dense cluster of rearrangements can also build up gradually, Korbel and Campbell (2013) set out criteria for inferring that a cluster arose in one event. Breakpoints should be clustered beyond chance. Copy number should oscillate regularly between two states, or occasionally three. Heterozygosity should be retained in the higher state and lost in the lower. The rearrangements should affect a single parental haplotype. Fragments should be joined in random order and in random orientation, so that the four possible junction types occur about equally often. And it should be possible to walk the derivative chromosome from one fragment end to the next. Automated callers that encode these tests were applied to the whole genomes of more than two thousand six hundred tumors by Cortés-Ciriano et al. (2020), who found the phenomenon to be far more widespread than early estimates suggested and often more complicated than the canonical form.
4. Chromothripsis in Solid Tumors of Childhood
Medulloblastoma provided the first clear pediatric association. Rausch et al. (2012) found chromothripsis in Sonic hedgehog subgroup tumors from children with germline TP53 mutations and proposed that loss of p53 function either permits the catastrophe or allows the cell to survive it. Later whole-genome analysis across the medulloblastoma subgroups confirmed the concentration of the pattern in TP53-mutant Sonic hedgehog disease (Northcott et al., 2017). The observation has clinical consequences beyond the tumor, because the finding of chromothripsis in a child's medulloblastoma is a reason to consider germline testing.
In neuroblastoma, Molenaar et al. (2012) detected chromothripsis in a subset of high-stage tumors, where it was associated with poor outcome and with structural changes affecting genes such as MYCN. Experimental work has since shown that shattered fragments can circularize into extrachromosomal DNA and that repeated rounds of breakage drive the evolution of gene amplification (Shoshani et al., 2021), a mechanism plainly relevant to an amplification-driven tumor.
Bone tumors stood out in the original report, in which chromothripsis was notably common (Stephens et al., 2011). Pediatric osteosarcoma genomes are dominated by structural variation, including rearrangements that inactivate TP53 through its first intron (Chen et al., 2014), and a pattern of chromothripsis followed by amplification has been described in the same disease (Behjati et al., 2017). Ewing sarcoma illustrates a neighboring category: in a substantial fraction of cases the defining EWSR1 fusion is produced by chromoplexy, a looped chain of rearrangements across several chromosomes, and not by a simple reciprocal translocation (Anderson et al., 2018). Pan-cancer studies of childhood tumors place these findings in a wider frame, in which complex rearrangement accompanies TP53 disruption across histologies (Gröbner et al., 2018).
5. Optical Genome Mapping
The method descends from the nanochannel genome mapping described by Lam et al. (2012). Ultra-high molecular weight DNA is extracted so as to preserve molecules hundreds of kilobases long. A labeling enzyme attaches a fluorophore at each occurrence of a six-base recognition motif, the molecules are driven electrophoretically into nanochannels that hold them stretched, and a camera records the label positions. The resulting pattern acts as a low-resolution barcode. Molecules are assembled into maps or aligned directly to an in-silico digest of the reference genome, and discordances are called as insertions, deletions, inversions, duplications and inter- or intrachromosomal translocations. Copy number is estimated separately from the depth of molecule coverage.
Clinical validation has so far been strongest outside solid tumors. Mantere et al. (2021) reported concordance with standard cytogenetic tests for constitutional aberrations whose breakpoints lie outside centromeric regions, and Neveling et al. (2021) reached a similar conclusion for hematological malignancies while also uncovering additional rearrangements that karyotyping, fluorescence in situ hybridization and arrays had missed. A study of acute lymphoblastic leukemia, which included pediatric patients, came to a comparable view (Lühmann et al., 2021). These results establish that the method reliably detects structural variants of the size and kind that make up a chromothripsis cluster.
5.1. What a shattered chromosome looks like on a map
Table 1 takes the inference criteria one at a time and states how far optical mapping can address each. Three of them fall within its strengths. Breakpoint clustering is seen directly as a pile of intrachromosomal fusion calls within one region, displayed in a circos plot as a dense tangle of arcs on a single chromosome. Copy number oscillation appears in the coverage track, though with coarser boundaries than sequencing gives. Connectivity is where long molecules offer something that short reads do not: a single molecule may span two or more junctions, so that the order and orientation of neighboring fragments are observed and not inferred, which helps both the test of random joining and the walk along the derivative chromosome.
| Criterion | What is examined | Assessment by optical mapping |
|---|---|---|
| Clustered breakpoints | Rearrangement junctions crowded into one chromosome or arm | Direct, from clustered fusion calls; resolution of a few kilobases |
| Oscillating copy number | Segments alternating between two, sometimes three, states | From molecule coverage; small segments may be smoothed over |
| Interspersed loss of heterozygosity | Allelic loss in the lower copy number state | Not read directly; needs array or sequencing data |
| Single haplotype affected | All rearranged fragments from one parental copy | Indirect at best, since no nucleotide variants are read |
| Random order and orientation | Four junction types in roughly equal proportion | Orientation of fused segments is reported for each call |
| Derivative chromosome walk | Fragment ends alternate so the chain can be traced | Aided by molecules that span several junctions |
The other criteria expose the limits of a method that reads labels and not sequence. Allelic state is not observed, so the interspersed loss and retention of heterozygosity that Korbel and Campbell (2013) treat as strong evidence for a single event cannot be read directly from the molecules, and assignment of all fragments to one haplotype is out of reach. Junction sequence is unavailable, which removes the main means of separating chromothripsis, with its blunt or near-blunt joins, from chromoanasynthesis, with its microhomology and templated insertions (Liu et al., 2011). Fragments shorter than the spacing of a few labels cannot be placed. And regions without a usable label pattern, including centromeres and the short arms of acrocentric chromosomes, are invisible, as they largely are to short reads.
The relatives of chromothripsis can be told apart to some extent on structural grounds. Chromoplexy shows as a chain of interchromosomal fusions joining several chromosomes with little change in coverage (Baca et al., 2013), a configuration that a map displays clearly and that differs from the single-chromosome tangle of the canonical event. Chromoanasynthesis is suggested when the coverage track shows gains to three or four copies without the alternating losses expected after shattering. These distinctions are matters of likelihood. Chromothripsis followed by amplification, as described in osteosarcoma and in tumors bearing extrachromosomal DNA, combines high copy number with dense rearrangement (Behjati et al., 2017; Shoshani et al., 2021), and a map alone will not always say which process came first.
5.2. Practical constraints in pediatric solid tumors
Several features of childhood solid tumors bear on feasibility. The assay needs long DNA, and therefore fresh or frozen tissue handled gently; formalin-fixed, paraffin-embedded blocks, which are often all that remains after diagnosis, are unsuitable. Biopsies are small, and the amount of viable tumor may be limited after necrosis or chemotherapy. Admixture of normal cells lowers the fraction of molecules that carry a rearrangement, and analysis pipelines built for low-fraction variants trade sensitivity for a higher minimum variant size. Subclonal chromothripsis, which sequencing studies show to be common (Cortés-Ciriano et al., 2020), will be the hardest case. None of these constraints is peculiar to optical mapping, but each should be stated when a result is reported.
6. Gaps and Future Work
The central gap is simple to state. Published use of optical genome mapping in solid tumors of childhood is limited to small series and individual case descriptions, and there is no large comparison in which the same pediatric tumors were assessed for chromothripsis by both optical mapping and whole-genome sequencing. The claim that the method detects the signature in these tumors therefore rests on inference from its validated performance for individual structural variants, not on direct demonstration.
Three kinds of work would close the gap. Paired analyses of the same specimens would show how often the two methods agree on the presence, extent and chromosome of a chromothripsis event. Calling rules adapted to map data are needed, since existing tools assume sequencing input and thresholds chosen for base-pair breakpoints cannot be carried over unchanged. Finally, reporting standards should require that a laboratory state which criteria were assessed and by which method. A report of chromothripsis based on clustering and oscillation alone is a weaker statement than one supported by allelic data, and the difference ought to be visible to the reader. Complementary long-read sequencing, which adds junction sequence and phasing, is the obvious partner where the distinction changes management.
7. Conclusion
Chromothripsis is an established feature of several pediatric solid tumors and carries diagnostic, prognostic and, through its link with germline TP53 mutation, familial significance. Optical genome mapping is well suited to showing the parts of its signature that depend on large-scale structure: clustered breakpoints, alternating copy number and the physical connection of rearranged fragments. It cannot show allelic state or junction sequence, and so cannot by itself satisfy every accepted criterion or separate chromothripsis cleanly from its relatives. Until direct comparisons in childhood tumors are published, an optical mapping result is best reported as a pattern consistent with chromothripsis, with the criteria examined set out explicitly.
Conflict of interest
To be declared by the author(s) before publication.
Funding
To be declared by the author(s) before publication.