1. Introduction
Fluoride enters groundwater mainly by the slow dissolution of fluorine-bearing minerals such as fluorite, apatite and the micas. Concentrations are highest in waters that are alkaline, rich in sodium and bicarbonate and poor in calcium, a combination found in parts of the East African Rift, the Indian subcontinent, northern China and several other regions (Edmunds and Smedley, 2013; Amini et al., 2008). A little fluoride protects teeth. Prolonged intake at higher concentrations causes dental fluorosis and, at higher levels still, skeletal fluorosis (Fawell et al., 2006). The World Health Organization keeps a guideline value of 1.5 mg/L for drinking water (WHO, 2017), and the Indian drinking water specification sets an acceptable limit of 1.0 mg/L with 1.5 mg/L permitted only where no alternative source exists (BIS, 2012).
Fluoride is colourless, tasteless and odourless at these concentrations, so a well cannot be judged by its users. It also varies sharply between wells a short distance apart, which means that district averages say little about any one source. Protecting a community therefore depends on testing individual wells, and in rural areas that is a matter of logistics as much as of chemistry: samples must travel to a laboratory, or the laboratory method must travel to the well.
Paper-based analytical devices were proposed for exactly this kind of setting. Since the first patterned-paper assays were described (Martinez et al., 2007), the format has been promoted as a route to inexpensive tests that need no power and little training (Martinez et al., 2010). Fluoride is a harder target than many because the established colour reactions are indirect and sensitive to other dissolved species. This article does not report a new sensor. It proposes a protocol for developing one and, above all, for showing whether it works on the waters for which it is intended. The protocol is a proposal and has not been tested here.
2. Background
The design draws on three bodies of knowledge: the reference methods against which any field device must be judged, the colour chemistry available for fluoride, and what is known about paper as an analytical substrate.
2.1. Reference methods
The fluoride ion-selective electrode, built around a lanthanum fluoride crystal, responds to fluoride activity over a wide range and remains the usual laboratory method (Frant and Ross, 1966). Samples are mixed with a buffer that fixes the ionic strength, holds the pH in the mildly acidic range and releases fluoride bound to aluminium and iron. The second standard method is photometric. Fluoride removes zirconium from a red zirconium-SPADNS lake, and the loss of colour is measured (Bellack and Schouboe, 1958). Both are set out in Standard Methods for the Examination of Water and Wastewater, together with the interferences that affect the photometric method: alkalinity, aluminium, iron, phosphate, sulfate and residual chlorine among them (APHA, 2017).
2.2. Colour reactions that could be transferred to paper
Two families of reaction are realistic candidates. Bleaching reactions, of which zirconium-SPADNS is the best known, start from an intensely coloured metal-dye complex and lose colour as fluoride competes for the metal. They are sensitive in the range of interest, but the reagent is strongly acidic and the signal is a decrease, which the eye judges less well than the appearance of a new hue. The complexone reaction works the other way: fluoride joins a lanthanum or cerium chelate of alizarin complexone to form a ternary complex of a different colour, and this reaction is also an accepted standard procedure (APHA, 2017). Both families respond to the same interfering ions as their solution counterparts, and neither reagent was designed to be stored dry on cellulose.
2.3. Paper as an analytical substrate
Cellulose paper wicks liquid by capillary action, holds dried reagents and gives a white background for colour. Hydrophobic barriers printed in wax confine a sample to defined zones (Carrilho et al., 2009). Reviews of the field describe recurring weaknesses as well as strengths: uneven colour caused by reagents migrating to the edge of a zone as it dries, sensitivity to humidity and temperature, batch variation, and limits of detection poorer than those of cuvette methods (Cate et al., 2015). Colour may be read against a printed chart or from a photograph. Camera-based reading was shown early to be workable (Martinez et al., 2008), and later work has documented how strongly the result depends on lighting, on the camera and on the way the image is processed (Capitán-Vallvey et al., 2015).
3. The Proposed Protocol
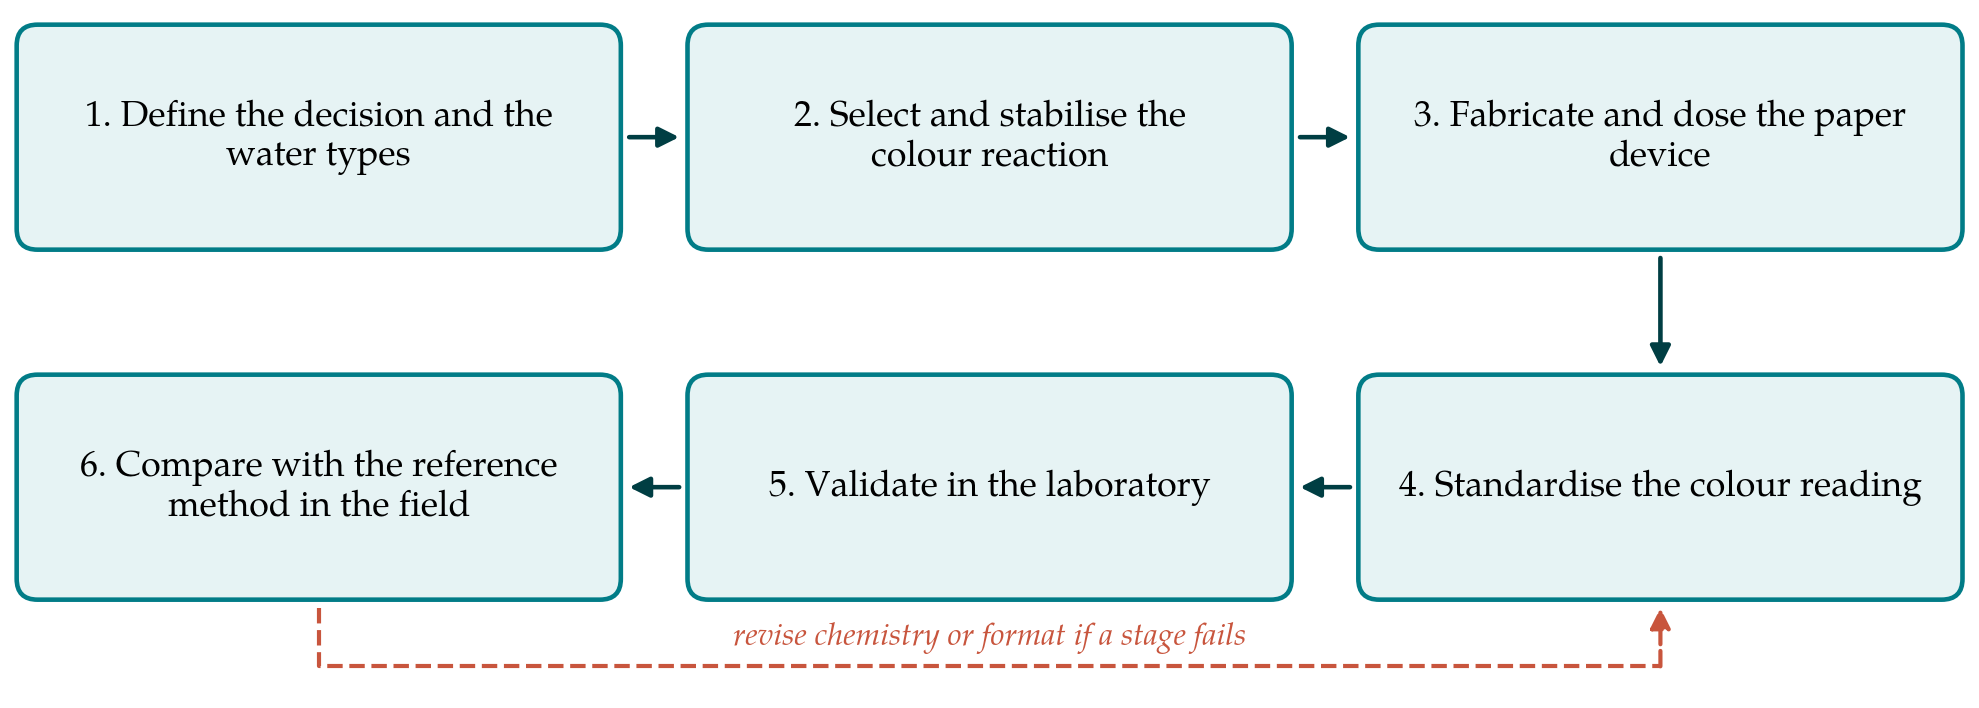
The protocol has six stages, shown in Figure 1. Each ends with a decision: proceed, or return to an earlier stage and change the chemistry or the format. The stages are described in turn. Their order matters because the commonest fault in this literature is to optimise a device in deionised water and to meet real groundwater only at the end.
3.1. Stage 1: Define the decision and the water types
A field device rarely needs to report a concentration to two figures. Its usual task is to sort wells into those that are safe, those that are unsafe and those that need a laboratory result. The developer should therefore begin by fixing the decision limit, normally the national standard, and the band around it within which an uncertain answer is acceptable. The second task is to describe the target waters. Published hydrochemical data for the region, or a small set of archived analyses, will show the expected ranges of pH, alkalinity, hardness, sulfate, phosphate, iron and aluminium. These ranges define the interference tests of Stage 5 and should be written down before any reagent is chosen.
3.2. Stage 2: Select and stabilise the colour reaction
The reaction is chosen against the requirement of Stage 1 and not for its performance in pure solution. The questions to be answered on the bench are whether the colour change across the decision limit is large enough to be seen, whether the reagent tolerates the alkalinity of the target waters once it is confined to a small paper zone with a limited buffer reserve, and whether it survives drying. Acidic bleaching reagents may degrade cellulose or lose acid on storage; chelate reagents may need a buffer and a masking agent deposited with them. Any stabiliser, polymer or surfactant that is added should be recorded with its amount, because later reproducibility depends on it.
3.3. Stage 3: Fabricate and dose the paper device
The format should be the simplest that controls the sample volume. A wax-patterned spot or a dip-strip with a single reaction zone is easier to make consistently than a branched channel, and a fluoride test has little need of multiplexing. Three things should be fixed and documented: the grade of paper, the amount of reagent deposited per zone and the way the zone is dried. A blank zone and, where possible, a zone carrying a known amount of fluoride give the user a check on reagent condition at the moment of use. Devices should be packed with desiccant in a light-proof pouch from the outset, since storage stability is part of the design and cannot be added afterwards.
3.4. Stage 4: Standardise the colour reading
Two reading modes should be developed in parallel. Visual comparison with a printed chart needs no equipment and should be the fallback. The chart must be printed from colours measured on real devices at known concentrations, and its steps should be closest together around the decision limit. Reading from a photograph can resolve smaller differences, provided that variation in lighting is controlled. A simple shade box or a printed reference patch beside the reaction zone allows the image to be normalised. The colour channel or combination used, the reading time after wetting and the calibration function should be fixed at this stage and not altered during validation.
3.5. Stage 5: Validate in the laboratory
Validation asks whether the finished device is fit for the purpose defined in Stage 1. The characteristics to be examined are those of general validation guidance (ICH, 2005; Magnusson and Örnemark, 2014), adapted to a device whose answer is a category as often as a number. Table 1 lists them with the experiment proposed for each.
| Characteristic | Proposed experiment | What the record should show |
|---|---|---|
| Working range | Fluoride standards spanning well below to well above the decision limit | Response curve and the range over which steps are distinguishable |
| Precision | Replicate devices at several levels, on different days and by different readers | Repeatability and between-day, between-reader variation |
| Trueness | Certified or gravimetrically prepared solutions; spiked natural water | Bias against the assigned value at each level |
| Selectivity | Standards with added bicarbonate, sulfate, phosphate, aluminium and iron at field levels | Concentration of each ion at which the reading shifts |
| Decision performance | Many devices at levels just below and just above the limit | Rates of false safe and false unsafe classification |
| Robustness | Deliberate changes in temperature, sample volume and reading time | Tolerances to be written into the instructions |
| Storage stability | Devices stored under warm, humid and ambient conditions, tested at intervals | Supported shelf life and packaging requirement |
Two of these deserve emphasis. Selectivity must be tested with the ions at the concentrations recorded in Stage 1 and in combination, since alkalinity and aluminium act in opposite directions on some reagents and can mask each other. Decision performance is the characteristic that matters most to a water programme: a device that calls an unsafe well safe does harm, while one that calls a safe well unsafe costs a confirmatory test. The proportion of each kind of error near the limit should be estimated from enough replicate devices to make the estimate meaningful, and the reading rule may then be set so that doubtful results fall on the cautious side.
3.6. Stage 6: Compare with the reference method in the field
Laboratory solutions cannot reproduce every feature of well water, so the final stage is a paired comparison on real sources. Each well is tested on site with the device by the kind of person who will use it, and a sample is taken in a plastic bottle for analysis by ion-selective electrode in a laboratory that runs quality control. The wells should be chosen to cover the range of fluoride and of water chemistry in the area, with a deliberate concentration near the decision limit. Agreement is then examined in two ways: as a cross-tabulation of categories against the reference result and, where the device gives a number, as a plot of differences against means in the manner of Bland and Altman (1986). A correlation coefficient alone is not evidence of agreement and should not be offered as such.
4. Fitting the Protocol to Rural Practice
Several features of village water testing should shape the device from the start. Users may be community health workers or pump caretakers, so the instructions must work as pictures and the procedure should have few timed steps. Reagents that are corrosive or toxic are a poor choice for household handling, which counts against strongly acidic formulations and rules out the arsenite used in the laboratory photometric method to remove chlorine. Used devices need a disposal route. Colour charts fade and should carry a date. The price that matters is the cost per reliable result, including the confirmatory tests that doubtful readings generate, and not the cost of the paper alone.
The device also has to sit within a programme. A positive screening result should trigger a defined action, such as a laboratory test, marking of the well or provision of an alternative source. Without that link a correct reading changes nothing, and the measurement effort is wasted.
5. Limitations and What Remains to Be Shown
The protocol is a proposal built from standard methods and published guidance, and nothing in this article demonstrates that a device developed by following it will meet its requirement. Whether any dry reagent can discriminate reliably around the guideline value in highly alkaline water is an open question that only Stage 5 and Stage 6 can settle for a given formulation. The protocol also leaves several choices to the developer, among them the number of replicate devices and the width of the uncertain band, because they depend on the consequences of error in the programme concerned.
Other matters lie outside its scope. It does not address manufacture at scale, regulatory approval or the behaviour of the device with surface water. It treats fluoride alone, although wells that are high in fluoride may also carry arsenic or nitrate. A screening test does not replace periodic laboratory analysis, and the protocol assumes that a reference laboratory remains available for confirmation.
6. Conclusion
Paper-based colour tests for fluoride are easy to propose and difficult to prove. The six-stage protocol described here places the proof at the centre: the decision and the target waters are defined first, the chemistry and format are chosen against them, and the device is judged by its classification errors near the limit and by paired comparison with a reference method on real wells. Applying the protocol to candidate chemistries, and publishing the results in the form it prescribes, would make such devices comparable with one another and would show which of them, if any, can be trusted at the well.
Conflict of interest
To be declared by the author(s) before publication.
Funding
To be declared by the author(s) before publication.