1. Introduction
A mango picked too early ripens with little flavour, and one picked too late softens in transit. The fruit is climacteric: it is harvested mature but unripe, and the starch laid down during growth is converted to sugars as it ripens. Maturity at harvest therefore sets an upper limit to eating quality that no later handling can raise (Kader, 1999). Growers judge maturity from the calendar, the fullness of the shoulders, changes in skin ground colour and, when a fruit is cut, the yellowing of the flesh near the seed. These signs vary with cultivar, season and position in the canopy, and the most informative of them destroys the fruit.
Near-infrared (NIR) spectroscopy offers a different route. Organic molecules absorb in the near-infrared through overtones and combinations of O-H and C-H vibrations, so the spectrum of light that has passed through fruit tissue carries information about water, carbohydrate and, in the visible range, pigments. The technique has been reviewed thoroughly for fruit and vegetables by Nicolaï et al. (2007) and, with an emphasis on commercial practice, by Walsh et al. (2020). For mango, the attribute of greatest interest has proved to be dry matter content, which integrates starch and sugars and changes little during ripening.
This article proposes a stepwise procedure for developing and maintaining a handheld NIR calibration for mango dry matter as a harvest maturity index. It is written for users who have access to an instrument and a basic laboratory but not to a specialist in chemometrics. No measurements are reported. The procedure is a synthesis of published methods, and its performance in any given setting remains to be demonstrated.
2. Background
Three matters need to be understood before the procedure is described: why dry matter is the chosen attribute, how a handheld instrument samples the fruit, and what has been learned about making calibrations hold from one season to the next.
2.1. Dry matter as a maturity index
Early studies showed that NIR spectra of intact mango could predict several physiological indices, including soluble solids, acidity and firmness (Schmilovitch et al., 2000). Soluble solids in a hard green fruit, however, say little about the fruit when ripe, because most of the carbohydrate is still starch. Saranwong et al. (2004) showed that dry matter and starch measured non-destructively at harvest could be used to predict the soluble solids of the ripened fruit, and Subedi et al. (2007) reached a similar conclusion with a short-wave instrument, adding flesh colour from the visible region as a second index. The same logic had been established earlier for kiwifruit (McGlone and Kawano, 1998). Dry matter is also simple to measure by a reference method that needs only a balance and an oven.
2.2. How a handheld instrument samples the fruit
Handheld fruit spectrometers use silicon detectors and work in the visible and short-wave near-infrared region, where radiation penetrates several millimetres into the flesh. Most use an interactance geometry in which the lamp and the detector are optically separated at the fruit surface, so that detected light has travelled through tissue and has not simply been reflected from the skin (Walsh et al., 2020). The measurement therefore represents a small volume beneath the contact point, and the reference sample must be taken from that volume. The spectra are dominated by water, and the features related to carbohydrate are small and overlapping, which is why multivariate calibration is needed (Williams and Norris, 2001).
2.3. Robustness across seasons and sites
A calibration built on one harvest often predicts the next one poorly. Work on in-line grading of stone fruit showed that robustness depends on including the relevant sources of variation, such as season, growing district and cultivar, in the calibration set (Golic and Walsh, 2006). Sample temperature must also be covered, because the water absorption bands shift with it (Nicolaï et al., 2007). For mango dry matter, Anderson et al. (2020) examined how a model could be made to hold across seasons, locations and cultivars and emphasised validation on populations not represented in calibration. Table 1 lists the sources of variation that the procedure below is designed to span.
| Source of variation | Why it matters | How the procedure handles it |
|---|---|---|
| Maturity stage | Sets the range of dry matter the model can predict | Sample from early to late harvest, including immature fruit |
| Cultivar | Skin thickness, pigments and flesh structure differ | Calibrate each cultivar; pool only after testing |
| Season and orchard | Growing conditions change tissue optical properties | Include several seasons and sites; validate on left-out groups |
| Fruit temperature | Water absorption bands shift with temperature | Scan the same fruit at cool, ambient and warm temperatures |
| Position on fruit | Dry matter varies between cheek, shoulder and tip | Fix one scanning position and core the same spot |
| Ambient light and operator | Stray light and poor contact add noise | Shade the fruit, check references, train operators |
| Instrument unit | Wavelength and response differ between units | Standardise units or transfer the calibration |
3. The Proposed Procedure
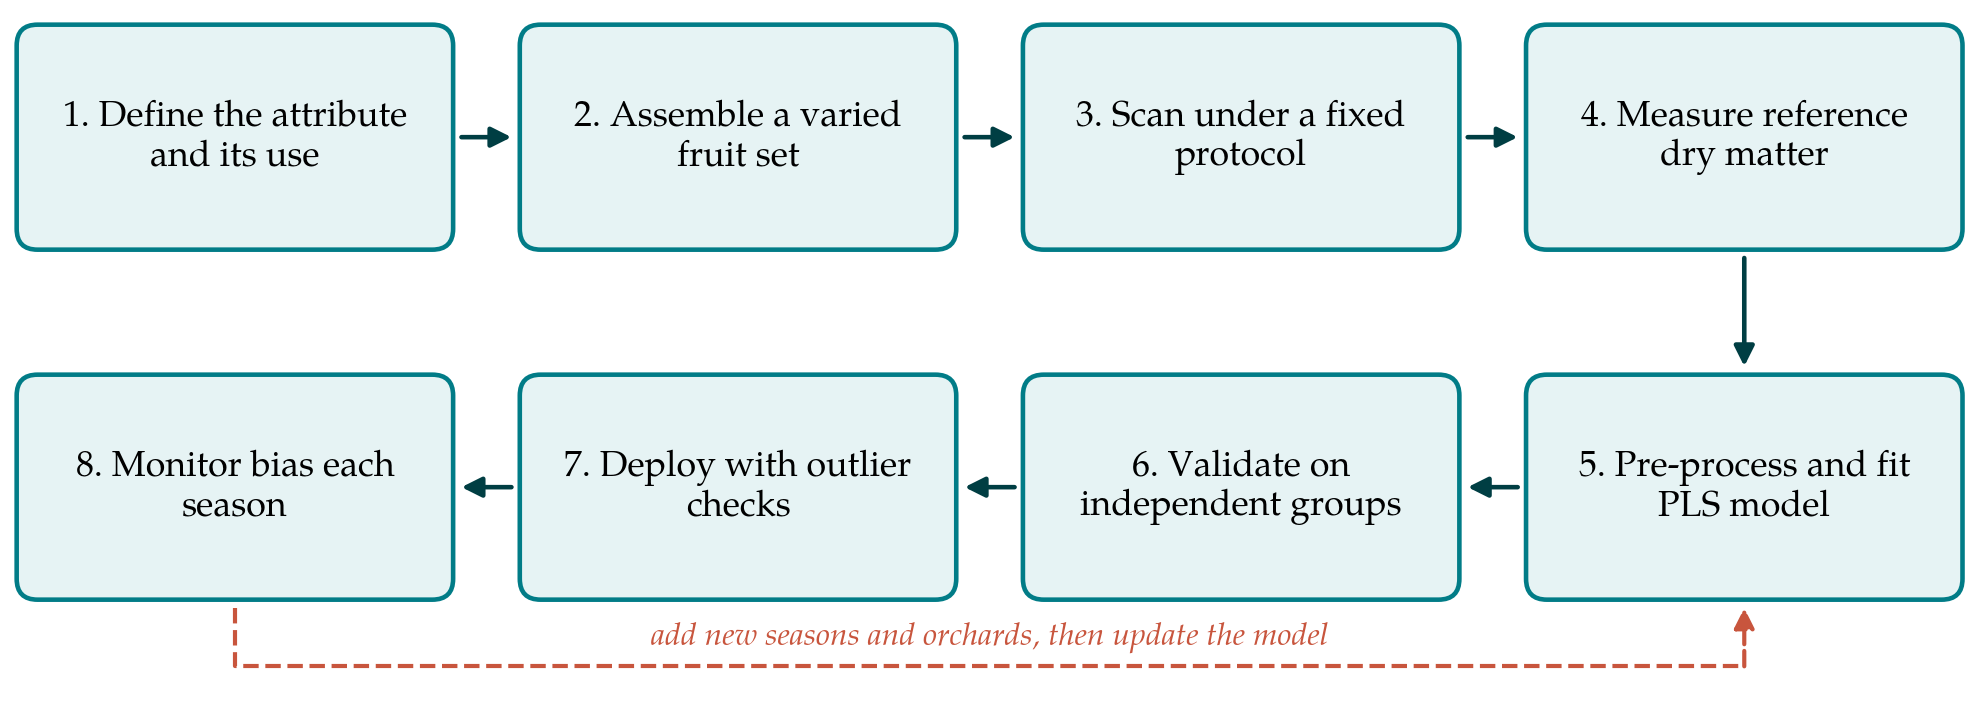
The procedure has eight steps, shown in sequence in Figure 1. The loop in the figure is deliberate: a calibration is never finished, and each season's fruit is used both to check the model and to extend it.
3.1. Step 1: Define the attribute and its use
The user should first write down what is to be predicted and what decision it will inform. The recommendation here is dry matter content of the flesh, expressed as a percentage of fresh weight, at a defined position on the cheek of the fruit. The intended use, for example ranking blocks for harvest order or checking consignments against a buyer's minimum, determines how accurate the calibration needs to be and whether results will be read per fruit or as a mean of a sample.
3.2. Step 2: Assemble a varied calibration set
Fruit for calibration should be chosen for diversity and not for convenience. The set should cover the full span of maturity likely to be encountered, with deliberate inclusion of immature and over-mature fruit, and should be drawn from several orchards, canopy positions and harvest dates. Where a large number of fruit has been scanned, a selection algorithm such as that of Kennard and Stone (1969) can pick a subset that covers the spectral space evenly, which keeps the reference work manageable. Fruit from at least two seasons should be included before the model is used for decisions.
3.3. Step 3: Scan under a fixed protocol
Each fruit is scanned at a marked position on the mid-cheek, away from blemishes and sap stains, with the instrument held square to the surface so that the seal excludes ambient light. Both cheeks may be scanned and treated as separate samples. The instrument's white and dark references are taken at the interval the manufacturer specifies. Fruit temperature is recorded, and a portion of the set is rescanned after cooling and after warming so that temperature variation is built into the calibration.
3.4. Step 4: Measure reference dry matter
The reference value limits everything that follows; a model cannot be more accurate than the method it is trained on (Williams and Norris, 2001). Immediately after scanning, a core or slice of flesh is taken from directly beneath the marked spot to a depth comparable with the optical sampling depth, the skin is removed, and the tissue is weighed, dried in a forced-air oven to constant weight and weighed again. A subset should be run in duplicate so that the repeatability of the reference method is known and can be compared with the prediction error.
3.5. Step 5: Pre-process the spectra and fit the model
Raw absorbance spectra contain baseline shifts caused by light scattering. The usual remedies are a second-derivative transform with Savitzky and Golay (1964) smoothing, the standard normal variate transform of Barnes et al. (1989), or both; the options are compared by Rinnan et al. (2009). The wavelength window should be restricted to the range in which the instrument's signal is reliable and which contains the water and carbohydrate bands. Partial least squares (PLS) regression is then fitted to relate the pre-processed spectra to reference dry matter (Geladi and Kowalski, 1986; Wold et al., 2001). The number of latent variables is chosen by cross-validation, and the simplest model whose error is close to the minimum is preferred, since additional factors tend to fit noise.
3.6. Step 6: Validate on independent groups
Cross-validation in which single fruit are left out gives an optimistic picture, because fruit from the same tree and day resemble one another. Segments should be whole harvest populations: all fruit from one orchard and date are left out together. Final validation uses populations from a season or site not present in calibration at all, as Anderson et al. (2020) recommend. The statistics to report are the root mean square error of prediction, the bias, the slope of predicted against reference values and the coefficient of determination, read against the range of the validation set (Næs et al., 2002). Bias deserves particular attention, because a model can rank fruit well and still be offset by a constant amount in a new population.
3.7. Step 7: Deploy with outlier checks
In the orchard, a sample of fruit is scanned on trees chosen to represent the block, at the same cheek position used in calibration. The software should flag any spectrum that lies far from the calibration population, by its distance in the model's score space or by a large spectral residual, and such readings are discarded or repeated. Block means, with a measure of spread, are compared with a dry matter threshold appropriate to the cultivar and market. That threshold is a commercial and sensory judgement to be set from published specifications or the buyer's requirement; the instrument does not supply it.
3.8. Step 8: Monitor and update
At the start of each season, and at intervals through it, a small set of fruit is scanned and then analysed by the reference method. If bias has appeared, it is corrected, and the new samples are added to the calibration set before the model is refitted. Where several instruments are in use, the same fruit are scanned on each so that differences between units can be detected. Methods for transferring a calibration from one instrument to another, such as piecewise direct standardisation, are reviewed by Feudale et al. (2002).
4. Fitting the Procedure to Practice
The demands of the procedure fall unevenly. Scanning is quick and can be done by trained field staff. The reference work is slow, and it is the usual reason calibrations are built on too few fruit. A packing enterprise without a laboratory can arrange drying through a local research station or share a calibration set within a grower group, provided that scanning protocols are identical. Manufacturers supply starting calibrations for mango with some instruments. These are useful, but they should be put through Steps 6 and 8 with local fruit before they are trusted, since the populations on which they were built are seldom disclosed in full.
A second practical point concerns sampling. An accurate reading on one fruit says little about a block in which fruit set over several flowering flushes. The number of trees and fruit to be scanned should be decided from the variability seen in the first surveys of a block, and fruit should be taken from both sides of the row and from inner and outer canopy positions.
5. Limitations and What Remains to Be Shown
The procedure is proposed and has not been validated here. Its components are drawn from published studies, but their combination in a given region, on given cultivars and with a given instrument is untested until a user tests it. Three things in particular would need to be shown: that prediction error on wholly independent seasons is small in relation to the difference in dry matter between acceptable and unacceptable fruit; that bias remains stable between monitoring checks; and that harvest decisions guided by the readings lead to ripened fruit of better and more uniform eating quality than decisions based on conventional indices.
There are also limits inherent in the measurement. The instrument samples a small volume under the skin of one cheek and cannot detect internal disorders located near the seed. Dry matter is an index of carbohydrate reserve and not of physiological age, so fruit that has accumulated dry matter slowly under poor growing conditions may be mature in other respects. For this reason dry matter is best read alongside flesh colour and the grower's knowledge of flowering dates, and not as a single criterion.
6. Conclusion
Handheld near-infrared spectroscopy gives mango growers a way to estimate dry matter on the tree without cutting fruit, and the published literature supports dry matter at harvest as a guide to ripe eating quality. The value of the measurement depends on the care with which the calibration is built and kept. The eight steps proposed here place most weight on the diversity of the calibration set, the quality of the reference analysis, validation on independent harvest populations and routine checks for bias. Whether the procedure delivers reliable harvest decisions in a particular production system is a question for field trials that this article does not attempt to answer.
Conflict of interest
To be declared by the author(s) before publication.
Funding
To be declared by the author(s) before publication.