1. Introduction
Scuffing is the abrupt, severe adhesive damage that occurs when the films protecting two lubricated surfaces break down and metal transfers between them. It differs from fatigue and from mild wear in giving very little warning. A gear pair or a cam and follower may run for long periods and then fail within a few revolutions once a critical combination of load, sliding speed and temperature is passed. Dyson (1975) reviewed the phenomenon half a century ago, and later reviews have found that no single criterion predicts it reliably across materials and lubricants (Ludema, 1984; Bowman and Stachowiak, 1996).
Because prediction is uncertain, laboratories determine scuffing limits by test, typically by raising load or sliding speed in stages on a disc machine or gear rig until failure is recognised. Recognition usually rests on friction torque, bulk or oil-out temperature, noise, or inspection between stages. All of these are lagging indicators: friction rises sharply only when a substantial part of the contact has scuffed, by which time the surface state that preceded failure has been destroyed. A signal that responds to the first localised adhesive events would allow tests to be stopped earlier and the surfaces examined at the point of transition.
Acoustic emission (AE) is a candidate for that signal. This article sets out a stepwise procedure for using it to detect scuffing onset in rolling-sliding contacts. The procedure is assembled from the published literature and from standard practice in AE measurement. It is offered as a method to be tested, and no experimental results are reported.
2. Background
Three bodies of work inform the design: the mechanics of scuffing, studies of AE generated by friction and wear, and earlier attempts to detect lubrication failure acoustically.
2.1. Scuffing in rolling-sliding contacts
The oldest and still most widely used scuffing criterion is the flash temperature hypothesis of Blok (1937), under which failure occurs when the sum of the bulk surface temperature and the transient temperature rise in the contact reaches a critical value. Later work has emphasised the collapse of the elastohydrodynamic film, desorption or exhaustion of boundary films, and the removal of protective oxide as contributing steps (Bowman and Stachowiak, 1996). Disc experiments have shown that surface finish strongly affects the load at which scuffing occurs at high sliding speed (Patching et al., 1995). The common element is that scuffing begins at isolated asperity contacts and spreads, so that a period of localised, intermittent adhesion precedes the general failure.
2.2. Acoustic emission from friction and wear
AE in a sliding contact arises from the elastic and plastic deformation of asperities, from fracture of asperities and surface films, and from the formation and rupture of adhesive junctions, and it occupies a band from tens of kilohertz to beyond one megahertz (Baranov et al., 2007). Early experimental studies related the AE count rate and root-mean-square (RMS) voltage to sliding speed, load and wear rate (Lingard and Ng, 1989), and distinguished adhesive from abrasive wear by the character of the signal (Boness and McBride, 1991). Fan et al. (2010) modelled the AE from sliding friction as the sum of elastic energy released at asperity contacts, which links the signal level to load, speed and surface topography. Hase et al. (2012) reported that adhesive and abrasive wear produce AE with different frequency content, an observation that suggests spectral features may help to identify the mechanism as well as its intensity.
2.3. Acoustic detection of lubrication failure
In machinery diagnostics AE has been applied to bearings and gearboxes for many years, with the repeated finding that it responds to changes in asperity contact and lubrication regime earlier than vibration does (Mba and Rao, 2006). Tan and Mba (2005) identified asperity contact under rolling and sliding as the main AE source in a spur gearbox. Closer to the present subject, Saeidi et al. (2016) described automatic detection of scuffing from AE in lubricated sliding tests, and Shevchik et al. (2017) used time-frequency features with a random forest classifier to recognise the state preceding failure. These studies support the premise that scuffing has an acoustic precursor. They used particular rigs, sensors and classifiers, and they leave open how a laboratory should configure the measurement on its own machine.
3. The Proposed Procedure
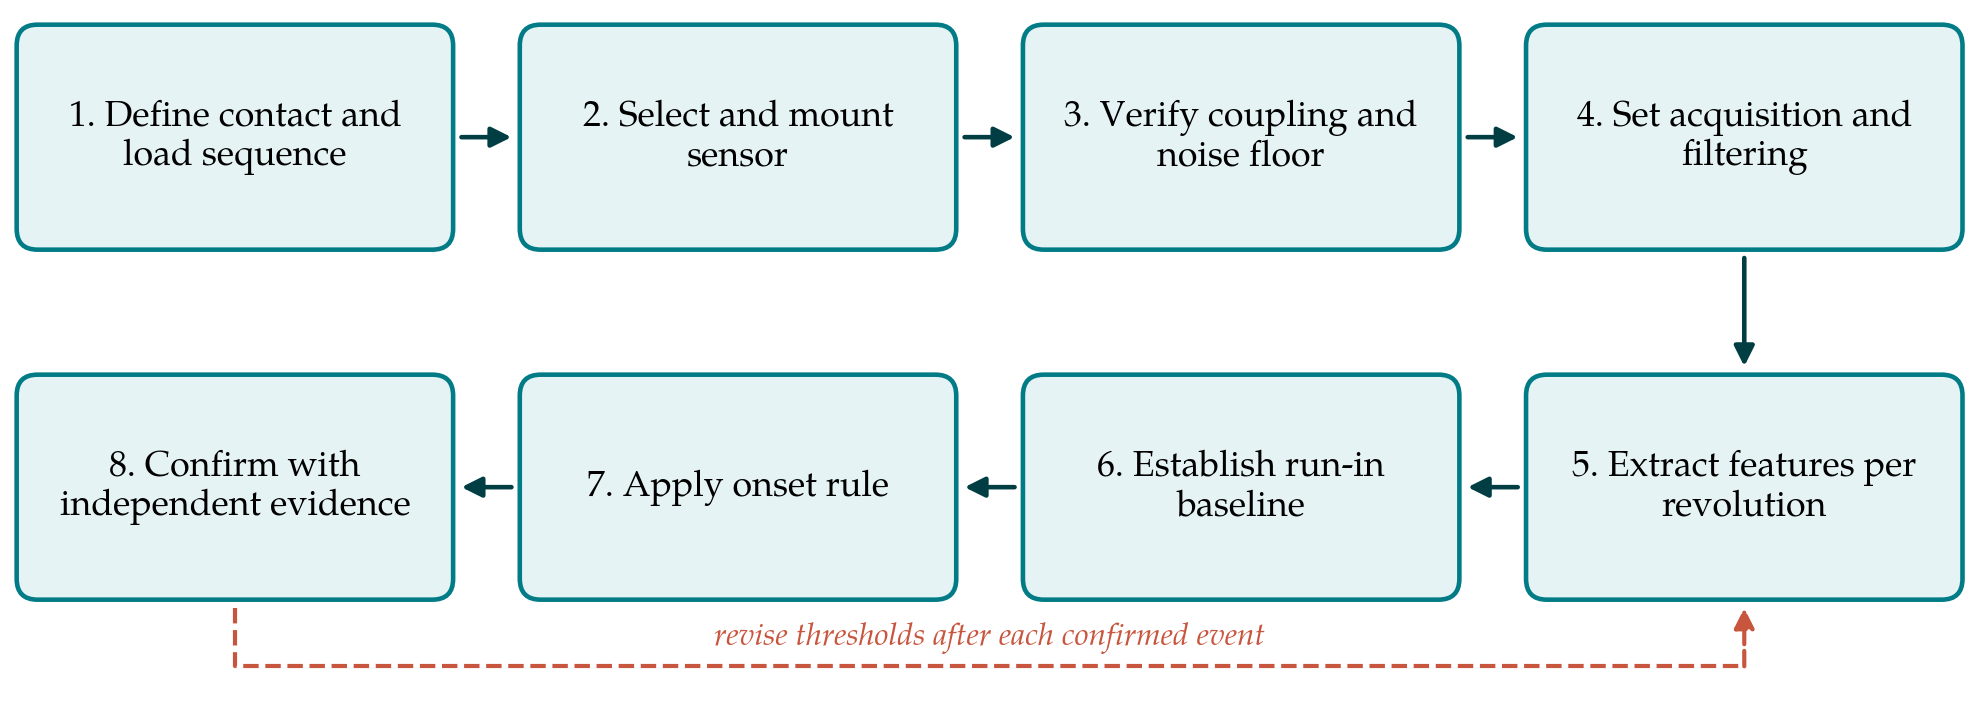
The procedure is set out for a twin-disc machine, in which two discs are loaded together and driven at different surface speeds to give a controlled slide-to-roll ratio. It applies with minor changes to ball-on-disc and gear rigs. Figure 1 shows the eight steps in sequence, with a return loop for revising detection thresholds once confirmed events are available.
3.1. Step 1: Define the contact and the load sequence
The test conditions determine what the AE signal can be expected to show, so they are fixed first. The record should state the disc materials, hardness and surface finish, the Hertzian contact pressure at each load stage, entrainment and sliding speeds, oil supply temperature and flow, and the calculated specific film thickness. A stepped-load sequence with stages of constant duration, analogous to that used in standard gear scuffing tests, gives a clear structure for baselines: each stage has its own steady state against which departures can be judged.
3.2. Step 2: Select and mount the sensor
A wideband piezoelectric sensor is preferred to a resonant one because the frequency content of the signal is itself of interest (Hase et al., 2012). The sensor cannot be placed on the rotating discs without slip rings or telemetry, so it is mounted on the nearest stationary component with a short, solid transmission path to the contact, normally a bearing housing or the loading arm. Every interface in that path attenuates and filters the wave. The path should cross as few joints as possible, the mounting face should be flat and clean, a couplant should be used, and the clamping force should be repeatable.
3.3. Step 3: Verify the coupling and the noise floor
Before each test series the transmission path is checked with a repeatable artificial source. The pencil lead break described by Hsu and Breckenridge (1981) is the accepted source, and ASTM E976 describes its use for checking the reproducibility of sensor response (ASTM International, 2015). Leads are broken at a marked point close to the contact and the peak amplitude and spectrum are recorded, which gives a reference for comparing later tests. The noise floor is then recorded in three conditions: machine stationary, shafts rotating with the discs separated, and discs in light contact under full-film lubrication. These recordings show which frequency bands are occupied by motor, bearing and electrical noise.
3.4. Step 4: Set acquisition and filtering
Scuffing precursors are expected to appear as a rise in continuous emission with superimposed bursts, so continuous streaming is more suitable than threshold-triggered hit recording, which discards the signal between hits. The sampling rate must exceed twice the highest frequency retained, with an analogue anti-aliasing filter ahead of the converter. A high-pass filter set above the band occupied by mechanical noise, as identified in Step 3, removes most machine-borne vibration. A once-per-revolution pulse from each shaft should be recorded on the same clock so that features can be related to angular position.
3.5. Step 5: Extract features per revolution
The raw stream is reduced to a small number of features computed over windows synchronised with disc rotation. Table 1 lists the features proposed and the reason for each. They are deliberately few and physically interpretable. The RMS level tracks the overall rate of energy release at the contact (Fan et al., 2010); a measure of impulsiveness responds to discrete adhesive events; and band energies capture a shift in spectral content. Spectral kurtosis, developed for detecting transients in rotating machinery signals (Antoni, 2006), may be used to choose the band in which bursts stand out most clearly from the background.
| Feature | How it is computed | Rationale | Caution |
|---|---|---|---|
| RMS level | Root mean square of the filtered signal per revolution | Follows total asperity interaction energy (Fan et al., 2010) | Also rises with speed and load steps |
| Kurtosis | Fourth standardised moment per revolution | Sensitive to isolated bursts from local adhesion | Falls again once bursts become continuous |
| Burst rate | Threshold crossings of the envelope per revolution | Counts discrete events (Lingard and Ng, 1989) | Depends on the threshold chosen |
| Band energy ratio | Energy in an upper band divided by energy in a lower band | Tracks spectral shift between wear modes (Hase et al., 2012) | Bands are specific to sensor and path |
| Angular pattern | Feature value against shaft angle | Separates a fixed surface defect from general distress | Needs a reliable once-per-turn pulse |
3.6. Step 6: Establish the run-in baseline
Freshly finished surfaces emit strongly while asperities are truncated during running-in, and the level then settles. Detection must not begin until this has happened. For each load stage the procedure therefore discards an initial interval and takes the mean and variability of each feature over the following steady period as the baseline for that stage. Normalising by the stage baseline removes the step changes in level that accompany each increase in load or speed and leaves the drift and excursions that are of interest.
3.7. Step 7: Apply an onset rule
An onset rule turns the feature histories into a decision. A fixed multiple of the baseline is simple but reacts either too readily to single outliers or too slowly to gradual change. A cumulative sum scheme of the kind introduced by Page (1954) for industrial process control accumulates small persistent departures and is well suited to this task. The proposal is to run such a scheme on the normalised RMS level and on kurtosis in parallel and to declare an indication when either exceeds its limit for a set number of consecutive revolutions. The limits are set initially from the baseline variability and are treated as provisional.
3.8. Step 8: Confirm with independent evidence
An AE indication is a hypothesis about the surface. On each indication the test is stopped, or in early trials allowed to continue to conventional failure with the time of the indication logged. Friction torque, disc bulk temperature and, where fitted, electrical contact resistance are examined over the same interval, and the discs are inspected by optical microscopy and profilometry for transferred material and local roughening. Only indications matched by physical evidence of incipient adhesion count as confirmed events. The interval between an indication and conventional failure, and the number of indications with no corresponding surface change, are the two quantities by which the thresholds are then revised.
4. Fitting the Procedure to a Laboratory
The procedure asks for equipment that most tribology laboratories either hold or can obtain at moderate cost: one wideband sensor and preamplifier, a digitiser with adequate sampling rate, and shaft encoders. Storage is the main practical burden of continuous streaming at megahertz rates, and it can be contained by computing features in real time and retaining raw data only for a rolling interval before each indication. Thresholds and frequency bands do not transfer between rigs because the transmission path differs, which is why Step 3 is repeated for every installation and after any change to the mounting. Where a machine-learning classifier of the kind used by Shevchik et al. (2017) is later adopted, the confirmed events gathered under Step 8 provide the labelled data it requires.
5. Limitations and What Remains to Be Shown
The procedure has not been applied here, and its usefulness depends on questions that only experiment can settle. The first is lead time: whether, on a given rig, the onset rule fires consistently before friction and temperature respond, and by how much. The second is the false indication rate under benign changes such as a load step, a change of oil temperature or the passage of a debris particle. The third is repeatability between nominally identical tests, given that scuffing loads themselves scatter widely. A validation study would run a series of stepped-load tests to conventional failure with the AE decision logged but not acted upon, and would report these three quantities.
There are also limits inherent in the method. AE amplitude at a remote sensor is a relative measure, affected by every joint in the path, so absolute levels cannot be compared between machines. In gear rigs the signal from the mesh is mixed with emission from the support bearings, which complicates attribution (Tan and Mba, 2005). Micropitting and running-in also raise AE activity, and distinguishing them from incipient scuffing by signal features alone may not always be possible. For these reasons the confirmation step is an essential part of the method.
6. Conclusion
Published work gives good grounds for expecting acoustic emission to register the localised adhesive events that precede scuffing in rolling-sliding contacts. What has been missing is a common way of arranging the measurement. The eight-step procedure proposed here fixes the test conditions, verifies the transmission path with a standard source, uses continuous acquisition with a few interpretable features, references each load stage to its own baseline, applies a cumulative change-detection rule and requires physical confirmation of every indication. It remains a proposal until tested, and the lead time, false indication rate and repeatability it achieves on real rigs are the measures by which it should be judged.
Conflict of interest
To be declared by the author(s) before publication.
Funding
To be declared by the author(s) before publication.