1. Introduction
Friction stir welding was invented at The Welding Institute at the start of the 1990s (Thomas et al., 1991) and has since become a standard way of joining aluminium alloys in rail vehicles, ships, aircraft and launch vehicle tanks. A rotating tool with a shoulder and a profiled pin is plunged into the joint line and traversed along it. The material is heated by friction and plastic work, stirred around the pin and consolidated behind it without melting (Mishra and Ma, 2005). The absence of fusion is the reason the process suits alloys of the 2xxx and 7xxx series that are difficult to fusion weld.
Solid-state does not mean stress-free. The weld region is heated and constrained by cooler surrounding plate and by rigid clamping, and on cooling it is left in longitudinal tension balanced by compression further out. Peak values are generally lower than in fusion welds but remain a significant fraction of the local yield strength, and they influence fatigue crack growth rates and distortion of thin panels (Threadgill et al., 2009; Withers, 2007). Engineers who wish to include these stresses in a damage tolerance assessment need measurements they can trust.
Trust is the difficulty. Residual stress cannot be measured directly. Every technique infers it from a strain, a displacement or a lattice spacing through a model, and each has assumptions that a friction stir weld is well placed to violate. This article proposes a step-by-step protocol that combines three widely available techniques so that the weaknesses of one are covered by another. It is addressed to university and industrial laboratories without routine access to large-scale facilities. The protocol is a proposal built from standards and published practice, and it is not validated here.
2. Background
Two bodies of knowledge underlie the protocol: the characteristic stress field of a friction stir weld, and the capabilities and limits of the available measurement techniques.
2.1. The stress field to be expected
A transverse section through a friction stir weld shows a stirred nugget of fine recrystallised grains, a thermo-mechanically affected zone of deformed grains on either side, a heat-affected zone and the parent plate. The advancing side, where tool rotation and traverse act in the same direction, differs from the retreating side (Nandan et al., 2008). The longitudinal stress, parallel to the weld, is the largest component. Its transverse profile commonly has an M shape: tensile across the weld, with peaks near the edge of the shoulder or in the heat-affected zone and a dip at the centre line, falling to compression in the parent plate. Peel et al. (2003) mapped the stresses in AA5083 welds by synchrotron diffraction and examined how they changed with welding speed. Transverse stresses are smaller, and in thin sheet the through-thickness component is usually taken as negligible.
Three features of this field shape the protocol. Gradients across the weld are steep, so spatial resolution matters. The stresses are of long range along the weld, so cutting a short coupon from a long joint relaxes them. And the mechanical properties vary across the zones: in precipitation-hardened alloys the heat-affected zone is softened, which lowers the local yield strength against which any plasticity-sensitive method must be judged.
2.2. Measurement techniques
Reviews of residual stress measurement divide techniques into diffraction methods, which use the crystal lattice as a strain gauge, and relaxation methods, which remove material and record the response (Withers and Bhadeshia, 2001; Schajer, 2013). Table 1 summarises the five techniques most often applied to friction stir welds and the caveat that each carries in this setting.
| Technique | What it provides | Depth reached | Main caveat in a friction stir weld |
|---|---|---|---|
| Laboratory X-ray diffraction | In-plane surface stress at a point | Tens of micrometres | Texture, coarse grains and the shoulder-affected surface layer |
| Incremental hole drilling | In-plane stress profile below the surface | About one millimetre | Local yielding around the hole in softened zones |
| Contour method | Map of the stress normal to a cut plane | Full section | One component only; destructive; cut quality |
| Neutron diffraction | Three strain components in the bulk | Centimetres in aluminium | Stress-free lattice spacing varies across the weld |
| Synchrotron X-ray diffraction | Fast in-plane strain maps through thin plate | Millimetres to centimetres | Elongated gauge volume; facility access |
Laboratory X-ray diffraction follows the sin-squared-psi method described in standard texts (Noyan and Cohen, 1987) and codified in a European standard (CEN, 2008). Hole drilling is governed by ASTM E837, which gives procedures for uniform and non-uniform stress (ASTM International, 2020). The contour method, introduced by Prime (2001), cuts the part in two, measures the deformed shape of the cut faces and computes the stress that must have been released. Neutron diffraction is described by an international standard (ISO, 2019) and a dedicated monograph (Hutchings et al., 2005). It is the natural reference technique, but beam time is scarce.
3. The Proposed Protocol
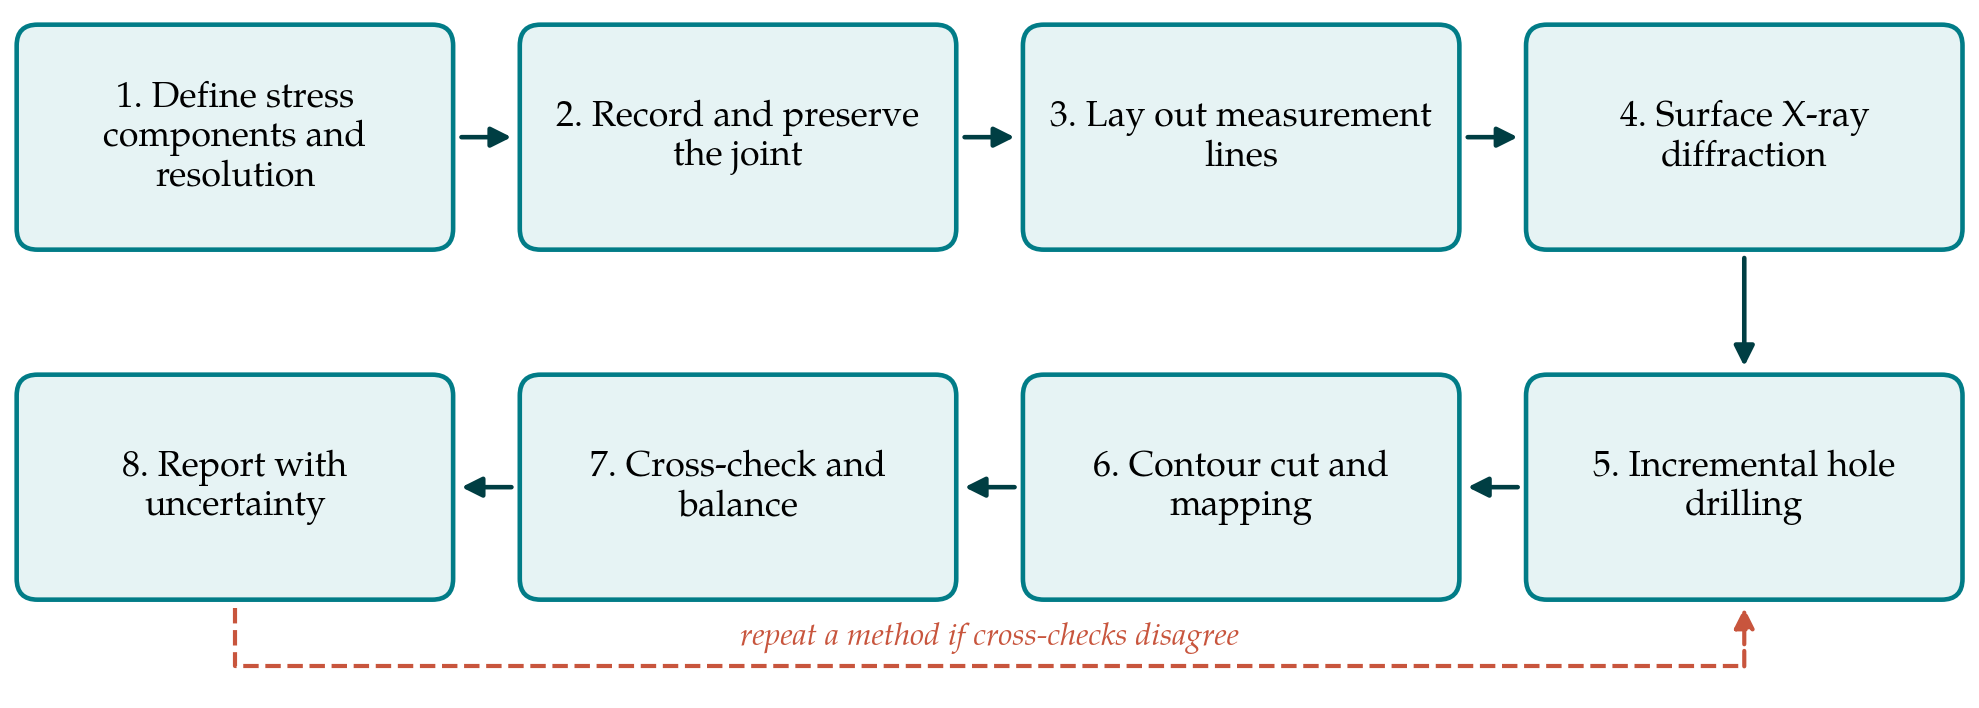
The protocol has eight steps, shown in Figure 1. They run from non-destructive to destructive, so that each technique sees the stress field before a later one disturbs it.
3.1. Step 1: Define the question
The first step is to write down which stress component is needed, where, and with what spatial resolution and accuracy. A fatigue crack growth assessment of a longitudinal weld needs the longitudinal stress through the full section. A distortion study may need only the integrated tensile force. A check on a surface treatment needs the near-surface profile. The answer decides which later steps carry the most weight and stops effort being spent on data that no one will use.
3.2. Step 2: Record and preserve the joint
The plate should be measured as welded and at the largest size the equipment allows. If it must be cut down, the length retained along the weld should be several times the width of the tensile zone, and the loss of stress on cutting should be estimated, for instance by strain gauges fixed before the cut. The record should include alloy and temper, thickness, tool geometry, rotation and traverse speeds, clamping arrangement, the advancing and retreating sides, the positions of the plunge and exit, and the time elapsed since welding, because naturally ageing alloys continue to change for weeks.
3.3. Step 3: Lay out the measurement lines
A transverse line at mid-length, well away from the start and the exit hole, is the primary line. It should extend far enough into the parent plate on both sides to capture the balancing compression. Points are spaced closely across the nugget, the thermo-mechanically affected zone and the heat-affected zone and more widely beyond. A hardness traverse on an adjacent offcut, or on the plate surface, locates the zone boundaries and the softened region. The same line is used for every technique so that results can be compared point by point.
3.4. Step 4: Surface X-ray diffraction
Surface stresses are measured along the line on both faces, in the longitudinal and transverse directions. For aluminium the usual choice is chromium K-alpha radiation with the {311} reflection, as recommended in good practice guidance (Fitzpatrick et al., 2005). Friction stir welds challenge the method in three ways. The crown surface carries a thin layer smeared by the shoulder, with its own stress state and tool marks. Rolled parent plate is textured and may have grains too coarse to give a smooth diffraction ring. And elastic constants differ slightly between alloys. The protocol therefore calls for light electropolishing to remove the smeared layer, oscillation of the specimen or beam to improve grain statistics, inspection of every sin-squared-psi plot for curvature or splitting, and rejection of points where the fit is poor.
3.5. Step 5: Incremental hole drilling
Hole drilling extends the surface result to a depth of roughly one millimetre. Rosettes are placed at selected points on the line: the weld centre, the expected tensile peaks on each side and one point in the parent plate. Drilling proceeds in small depth increments with a high-speed air turbine or orbital cutter, and stresses are computed with the non-uniform procedure of the standard (ASTM International, 2020; Grant et al., 2006). The method assumes elastic behaviour, and the stress concentration at the hole edge means that results become unreliable when the residual stress approaches the yield strength. In a weld the relevant yield strength is the local one, which in the softened zone may be far below the parent value. The local hardness from Step 3 should be used to judge whether each rosette lies within the valid range.
3.6. Step 6: Contour cut and mapping
The contour method is applied last because it destroys the specimen. The plate is clamped symmetrically and cut along the measurement plane by wire electro-discharge machining in a single pass with finishing settings. Both cut faces are measured with a coordinate measuring machine or optical profilometer, the two data sets are averaged to cancel shear and cutting-path effects, the result is smoothed, and the negative of the averaged contour is applied as a displacement boundary condition in an elastic finite element model. The output is a map of longitudinal stress over the whole cross-section. Prime et al. (2006) applied the method to a thick dissimilar-alloy friction stir weld and found good agreement with neutron diffraction. In thin sheet the surface displacements are small, and the measurement noise sets a practical lower limit on thickness.
3.7. Step 7: Cross-check and balance
Three checks are proposed. Where techniques overlap, at the surface and to the depth reached by hole drilling, the values should agree within their combined uncertainties. The longitudinal stress integrated over the full cross-section must sum to zero force, and to zero moment about each axis, if the plate is free. A marked imbalance signals an error or a line that does not reach far enough into the parent plate. Where neutron or synchrotron data can be obtained, they provide an independent bulk reference, with the caution that the stress-free lattice spacing changes across the weld as solute dissolves and reprecipitates and must be measured on a comb or matchstick specimen cut from a companion weld (Hutchings et al., 2005).
3.8. Step 8: Report with uncertainty
The report should allow another laboratory to repeat the work. It states the specimen size and cutting history, the measurement positions relative to the weld centre line and the advancing side, the instrument settings, the elastic constants used, and an uncertainty for each value evaluated according to the international guide (JCGM, 2008). Counting statistics alone understate the uncertainty of a diffraction result. Positioning error in a steep gradient, the reference spacing and the elastic constants usually contribute more.
4. Fitting the Protocol to Practice
Not every laboratory will need every step. For thin sheet of a few millimetres, where through-thickness variation is small, Steps 4 and 5 on both faces may suffice and the contour cut can be omitted. For thick plate the contour method carries most of the information and surface diffraction serves mainly as a check. Dissimilar-alloy joints need separate elastic constants and, for diffraction, separate reference spacings on each side. Welds in steels or titanium follow the same logic with different radiation and reflections. Where many welds are to be compared, a full protocol on one or two and a reduced set on the remainder is a sensible economy.
5. Limitations and What Remains to Be Shown
The protocol has been assembled from published methods and is offered as a proposal. It has not been applied here to any weld, and its claims rest on the documented behaviour of the individual techniques. Whether the combination delivers better agreement between laboratories than current ad hoc practice is an empirical question, best answered by a round-robin on welds cut from one long joint. The thresholds suggested for rejecting diffraction points or hole-drilling results are matters of judgement that such an exercise would sharpen. The protocol also measures the stress in a plate at rest, and says nothing about how that stress redistributes when a component is machined from it or loaded in service.
6. Conclusion
Residual stress in a friction stir weld can be characterised with equipment found in many materials laboratories, provided the measurements are sequenced and checked. The eight steps set out here preserve the stress state, place surface diffraction, hole drilling and the contour method on a common line, test the result against equilibrium and report it with an honest uncertainty. The protocol awaits validation by comparative trials.
Conflict of interest
To be declared by the author(s) before publication.
Funding
To be declared by the author(s) before publication.