1. Introduction
Every audit conducted under international standards includes a test of journal entries. The requirement comes from the presumption that management is in a position to override controls, and that override often takes the form of entries posted directly to the general ledger (IAASB, 2009). In a large firm the test is run with proprietary software over the whole population. In a practice of three partners and a handful of staff it is more often a spreadsheet filter applied to an export that may or may not be complete.
The filters used are sensible. They come straight from the characteristics the standards list: entries to seldom-used accounts, entries by people who do not normally post, entries at period end with thin explanations, round numbers. Their weakness is that they are fixed in advance. An entry that is odd in a way nobody anticipated passes through, and a client who knows the list can stay clear of it. Research on journal entry data has shown that statistical approaches surface patterns that rule lists miss (Debreceny and Gray, 2010), and the wider literature on audit analytics has argued for some time that such methods belong in ordinary engagements (Appelbaum et al., 2017).
This article is addressed to the small practice. It proposes a stepwise procedure for adding unsupervised anomaly detection to journal entry testing using freely available software, in a form that can be explained to a reviewer and documented on file. It does not report an application of the procedure to real data. The contribution is the method and the reasoning behind each step.
2. Background
Three strands of prior work bear on the design: what the standards require, what rule-based testing can and cannot do, and which unsupervised methods suit ledger data.
2.1. What the standards require
ISA 240 asks the auditor to design and perform procedures to test the appropriateness of journal entries recorded in the general ledger and other adjustments made in preparing the financial statements. The auditor is to make enquiries about inappropriate or unusual activity, select entries made at the end of the period, and consider the need to test entries throughout it (IAASB, 2009). The United States standard on fraud contains equivalent requirements (PCAOB, 2016). Neither standard prescribes a technique. Both expect the selection to be reasoned and the reasoning to be recorded.
2.2. Rule-based tests and their limits
The best known statistical screen is digit analysis based on Benford's law, introduced to auditors by Nigrini and Mittermaier (1997). It is quick and needs only the amounts, but it works at the level of the population: it says that a set of entries has too many amounts starting with a given digit and not which entries to examine. Filters on time, user and account identify individual entries but generate long lists, and a long list in a small firm means that only the top of it is ever looked at. No et al. (2019) treat this as the central practical problem of audit analytics and propose prioritising exceptions instead of sampling from them. A taxonomy of data mining applications in fraud detection is given by Gray and Debreceny (2014).
2.3. Unsupervised methods
Supervised models need labelled examples of fraudulent entries, and an audit firm almost never has them. Unsupervised methods need none. They characterise what is typical in the data and score each record by its distance from it (Chandola et al., 2009). Early work applied such ideas to large ledgers (Bay et al., 2006), and later studies trained autoencoder networks to flag entries that reconstruct poorly (Schreyer et al., 2017). For a small practice two methods stand out. The isolation forest scores a record by how few random splits are needed to separate it from the rest (Liu et al., 2008); it is fast, has few settings and copes with mixed features. The local outlier factor compares the density around a record with the density around its neighbours (Breunig et al., 2000) and tends to catch entries that are unusual within their own account or user group. Both are implemented in scikit-learn (Pedregosa et al., 2011).
3. The Procedure
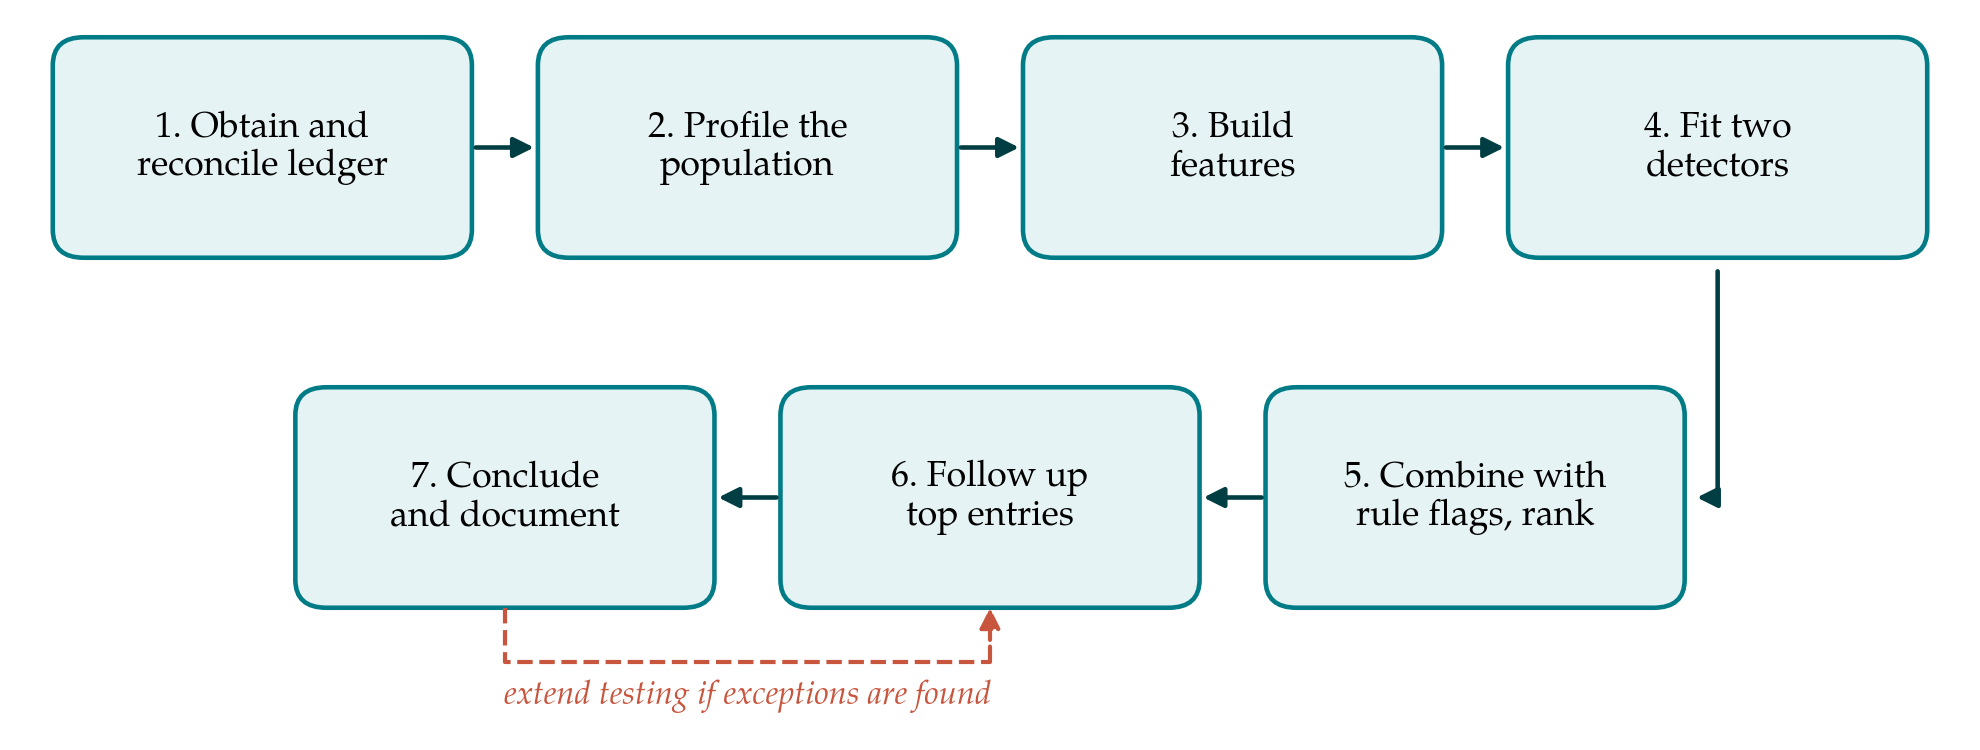
The procedure has seven steps. Table 1 lists them with the record each should leave, and Figure 1 shows how they connect. The steps are described in turn below.
| Step | What the auditor does | Record kept on file |
|---|---|---|
| 1. Obtain and reconcile | Extract every journal line for the period and agree the totals to the trial balance | Extraction request, record counts, reconciliation |
| 2. Profile | Summarise entries by account, user, source, month and amount | Profile tables and points noted |
| 3. Build features | Derive a small set of features that an auditor can explain | Feature list with definitions |
| 4. Fit detectors | Run an isolation forest and a local outlier factor on the features | Settings, software version, random seed |
| 5. Combine and rank | Merge the two scores with conventional rule flags into one ranked list | Ranking rule and the ranked list |
| 6. Follow up | Examine the highest-ranked entries against supporting evidence | Entries tested, evidence seen, conclusions |
| 7. Conclude and document | Evaluate results, extend testing if needed, record the rationale | Summary memorandum |
3.1. Step 1: Obtain and reconcile the ledger
Nothing downstream is worth doing unless the data are complete. The auditor should request every journal line for the period, including opening and closing entries and postings from sub-ledgers, with at least the entry number, line number, posting date, entry date, account, amount, user, source and description. The file is then rolled forward: opening balances plus the net movement per account should equal the closing trial balance. Differences are investigated before any analysis begins.
3.2. Step 2: Profile the population
Profiling is ordinary descriptive work: how many entries and lines, who posts them, from which sources, in which months, to which accounts. It serves two purposes. It gives the auditor the understanding of the client's posting patterns that later makes an anomaly interpretable, and it reveals data problems, such as a missing month or a generic user identifier, that would otherwise distort the scores.
3.3. Step 3: Build interpretable features
The detectors work on numbers, so each entry must be described numerically. The temptation is to generate many features. For a small practice the better course is a short list that maps onto the characteristics named in ISA 240, so that any flagged entry can be explained in the standard's own terms. A workable set is: the logarithm of the amount; whether the amount is round; the day of the week and hour of posting; the number of days between entry date and period end; the gap between posting date and entry date; how often the user posts; how often the account is used; how often that pair of debit and credit accounts occurs together; whether the source is manual; and the length of the description. Frequencies are computed from the client's own data, which is what makes a rare account pairing rare.
3.4. Step 4: Fit two detectors
An isolation forest is fitted to the feature table with default settings and a fixed random seed, so that the run can be reproduced. A local outlier factor is fitted separately, with entries grouped by account class where the ledger is large. Two detectors are used because they fail differently: the forest favours entries that are extreme overall, the local method those that are odd for their neighbourhood. Neither score is a probability of fraud, and the file should say so.
3.5. Step 5: Combine with rule-based flags and rank
The scores are converted to ranks and averaged. Conventional flags are then added as a count: manual entry, period-end posting, senior user, round amount, blank description. Entries are ordered first by the number of flags and then by the average rank. The effect is that an entry which is both statistically unusual and conventionally suspect rises to the top, while the purely statistical outliers follow. The auditor fixes in advance how many entries will be examined, having regard to assessed fraud risk and materiality, and does not adjust the number after seeing the list.
3.6. Step 6: Follow up
Each selected entry is traced to its support: the authorisation, the underlying document, the business reason. Anomaly scores often flag entries that are unusual and entirely proper, such as an annual insurance premium or a one-off asset disposal, and these are cleared quickly. What matters is that the reason for clearing is evidence and not management's explanation alone.
3.7. Step 7: Conclude and document
The auditor records what was done, what was found and what it means for the assessed risk of override. If exceptions are found, testing is extended down the ranked list. The memorandum should let an experienced auditor with no connection to the engagement understand the selection and repeat it.
4. Fitting the Procedure to a Small Practice
Three constraints shaped the design. The first is skills. The whole procedure can be run from a short script by someone comfortable with spreadsheets and willing to learn a little Python; no model is trained in the sense of being tuned, and the defaults are used deliberately. The second is time. On a ledger of a few hundred thousand lines the computation takes minutes, and the cost lies in the first engagement, when the extraction and the script are set up. The third is confidentiality. Client ledgers should be processed on the firm's own machines and not uploaded to online services, and the script and its outputs retained with the audit file.
5. Limitations and What Remains to Be Shown
This article proposes a procedure and does not test it. Three things would need to be established before it could be recommended without reservation. One is detection: whether, on ledgers seeded with entries of the kind the standards describe, the ranked list places them near the top more reliably than filters alone. A second is workload: how many of the top-ranked entries in real engagements turn out to be proper, since a method that buries the reviewer in false alarms will be abandoned. The third is stability: whether the ranking changes much between runs or with small changes to the feature list. Each can be examined with data a practice already holds, and each is a natural subject for a follow-up study.
Two further cautions apply. Unsupervised methods find what is rare, and a fraud carried out through many ordinary-looking entries will not be rare. The procedure supplements professional scepticism and the other responses to override risk; it does not replace them. And an anomaly score, however it is computed, is a reason to look and never a finding in itself.
6. Conclusion
Small audit practices can add unsupervised anomaly detection to journal entry testing with free software and modest effort. The seven-step procedure set out here keeps the features interpretable, pairs the statistical ranking with the familiar rule-based flags, and builds documentation into each stage. Its value in practice is an empirical question that this article leaves open and that practitioners and researchers are well placed to answer together.
Conflict of interest
To be declared by the author(s) before publication.
Funding
To be declared by the author(s) before publication.