1. Introduction
A transplanted kidney sheds fragments of its own DNA into the recipient's blood whenever its cells die. Because donor and recipient differ at many single-nucleotide polymorphisms, those fragments can be told apart from the recipient's own and counted. The idea was demonstrated in heart recipients by shotgun sequencing (Snyder et al., 2011; De Vlaminck et al., 2014) and reached kidney transplantation once targeted assays made the measurement practical without a donor sample (Grskovic et al., 2016). The multicentre study by Bloom et al. (2017) then showed that the donor fraction was higher in recipients with biopsy-proven active rejection than in those without, and commercial testing followed quickly.
The evidence behind that testing is largely cross-sectional. A blood sample is drawn close to a biopsy and the result is compared with the histology. Systematic and narrative reviews have noted how few studies follow the same recipients through time (Knight et al., 2019; Gielis et al., 2015). Clinicians, however, do not meet the marker as a single number. They see a third result that is higher than the second, or a value that has crept upwards over four months while creatinine has stayed flat, and they must decide whether that pattern means anything.
This article proposes a study design for describing those patterns in the first post-transplant year. It is written for a transplant programme, or a small group of programmes, that already has access to an assay and wants to learn from its use in an organised way. No data are reported. The design has not been applied, and its feasibility and yield remain to be tested.
2. Background
Three bodies of published work shape the design: the assays and the units they report, the early kinetics after implantation, and the sources of variation that have nothing to do with rejection.
2.1. Assays and units
Two families of assay are in common use. One sequences a panel of polymorphic sites and reports donor DNA as a percentage of total cell-free DNA (Grskovic et al., 2016); a related approach uses massively multiplexed polymerase chain reaction before sequencing (Sigdel et al., 2019). The other uses droplet digital polymerase chain reaction and can report an absolute concentration in copies per millilitre of plasma (Oellerich et al., 2019; Whitlam et al., 2019). The distinction matters for trajectories. A fraction has the recipient's own cell-free DNA as its denominator, so it falls when that denominator rises, as it does with infection or tissue injury elsewhere, even if the graft is releasing exactly as much DNA as before. Groups using absolute quantification have argued that it is the more robust measure of graft injury for this reason.
2.2. Early kinetics
Donor-derived cell-free DNA is very high in the hours after reperfusion, reflecting ischaemic injury to the graft, and then declines over the following days towards a low plateau (Gielis et al., 2018). The marker is cleared within hours, so the decline tracks ongoing release and not slow elimination. How fast the plateau is reached, and how donor type and delayed graft function alter the descent, are described in small series only. A surveillance value taken in the second week therefore cannot be read against a threshold derived from stable recipients months after surgery.
2.3. Variation unrelated to rejection
Bromberg et al. (2017) measured the marker repeatedly in stable recipients and estimated its within-person biological variation, following the framework set out by Fraser (2001). Their central point was that successive results in one person must differ by a sizeable proportion before the difference exceeds what biology and the laboratory produce by chance. Beyond random variation, injury of any kind releases donor DNA. Polyomavirus nephropathy, pyelonephritis and a recent needle biopsy can all raise the value, and early clinical experience showed that the marker separates antibody-mediated rejection from quiescence better than it separates T cell-mediated rejection (Huang et al., 2019). Longitudinal work has linked persistently raised values with later loss of function and with new donor-specific antibody (Bu et al., 2022), and paired comparison with the molecular phenotype of biopsies has confirmed a close relation to active antibody-mediated injury (Halloran et al., 2022). None of these studies set out to describe the shape of the first-year curve in unselected recipients.
3. The Proposed Design
The proposal is a prospective, observational cohort study in which every consecutive consenting adult recipient of a kidney-only transplant is sampled on a fixed schedule for twelve months. Care is not altered by the study results unless the treating team already uses the test clinically, in which case that use is recorded. Table 1 summarises the main design choices and the reasoning for each.
| Design element | Proposed choice | Reason |
|---|---|---|
| Cohort | Consecutive adult kidney-only recipients, living and deceased donor | Avoids selection by clinical suspicion |
| Exclusions | Multi-organ or repeat grafts, pregnancy, identical-twin donors | More than two genomes, or none distinguishable, confound the assay |
| Sampling | Dense in the first two weeks, sparser to month twelve | Matches the steep early fall and the later plateau |
| Units | Donor fraction and absolute concentration, both recorded | Fraction depends on recipient cell-free DNA |
| Event log | Infection, biopsy, surgery and drug changes dated against each draw | Lets non-rejection causes of a rise be identified |
| Reference standard | Banff-graded histology read blind to the marker | Prevents incorporation bias |
| Analysis | Mixed models on the log scale, then joint models with events | Handles repeated, unevenly spaced and censored data |
3.1. Cohort and eligibility
Consecutive enrolment is the most important single feature. Published accuracy estimates come mostly from recipients biopsied for cause, in whom rejection is common, and a trajectory study drawn from the same group would describe abnormal curves without ever defining the normal one. Recipients of living and deceased donor kidneys should both be included and analysed with donor type as a covariate. Recipients carrying a previous graft, those with a multi-organ transplant, pregnant recipients and recipients of a kidney from an identical twin should be excluded, since in each case the assumption of two distinguishable genomes fails.
3.2. Sampling schedule
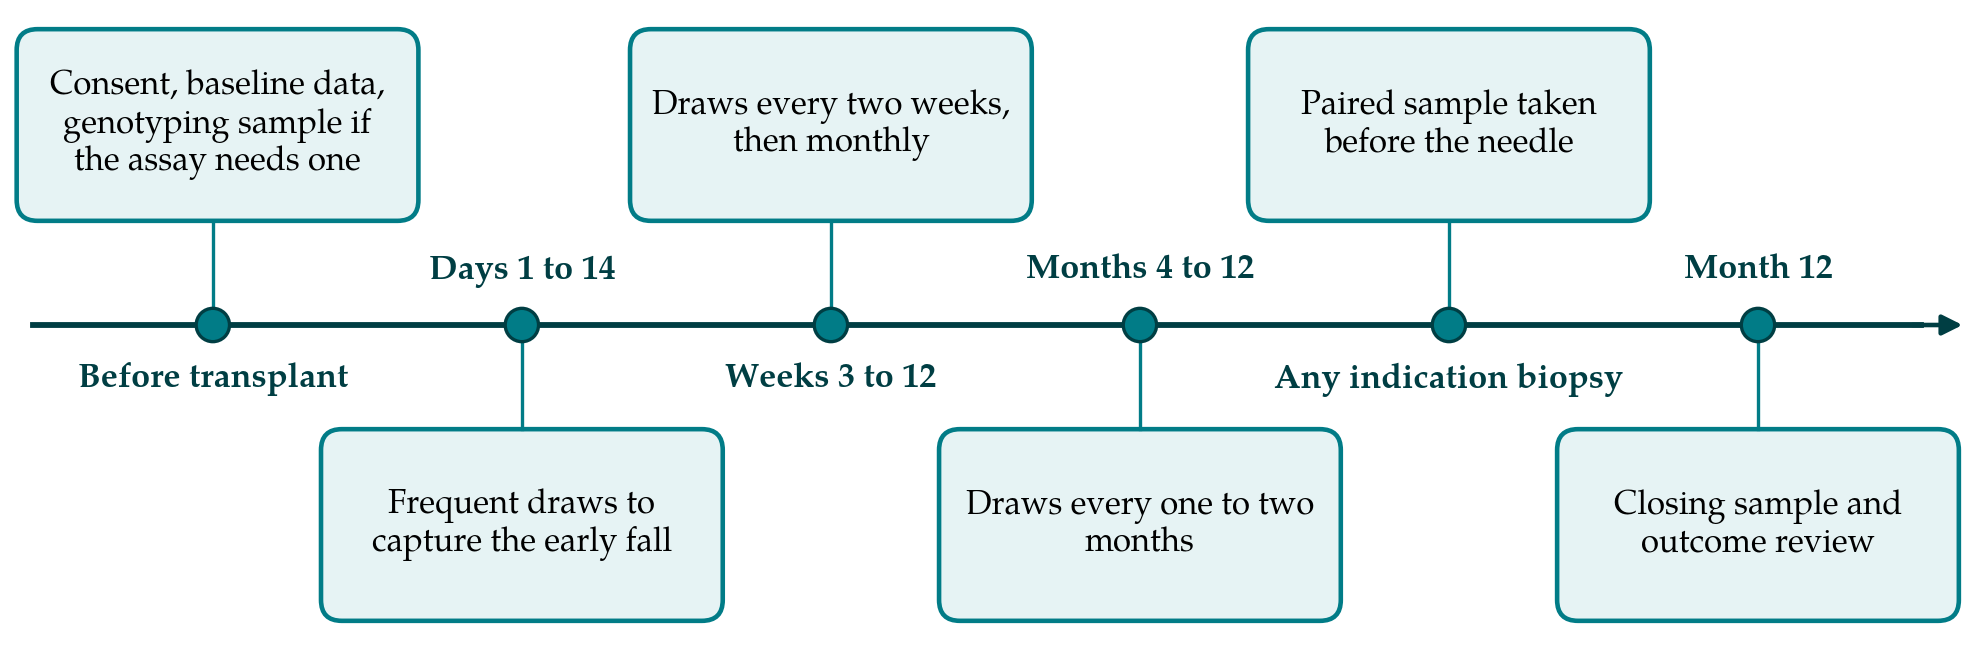
Figure 1 shows the proposed schedule. Draws are concentrated where the curve is expected to change fastest. In the first fortnight samples are taken several times a week while the recipient is in hospital or attending clinic frequently, so that the descent from the post-reperfusion peak can be fitted for each person. From the third week to the third month sampling is fortnightly and then monthly, coinciding with routine blood tests so that no extra visit is needed. From the fourth month it follows the clinic schedule. A sample is also taken immediately before any biopsy, whether for cause or by protocol, since a draw taken afterwards will carry DNA released by the needle.
3.3. Sample handling and measurement
Cell-free DNA results are sensitive to what happens between the vein and the freezer. White cells that lyse in the tube release recipient DNA and dilute the donor fraction. The protocol should therefore fix the collection tube, the maximum time to centrifugation, the centrifugation steps and the storage temperature, and should record deviations. Where samples are sent to a commercial laboratory, the kit instructions define these steps and the study records compliance. Each result should be stored with both the donor fraction and, where the assay provides it, the absolute concentration and total cell-free DNA, so that a falling fraction can be separated into its numerator and denominator.
3.4. Clinical events and the reference standard
For every draw the study records serum creatinine, urinary protein, tacrolimus trough, viral loads if measured, and any dated event in the preceding fortnight: infection, surgery, biopsy, transfusion, change in immunosuppression. Donor-specific antibody is recorded whenever tested. Biopsies are graded by the Banff criteria (Loupy et al., 2020) by a pathologist who does not know the marker result, and the laboratory measuring the marker does not know the histology. This follows the reporting standard for diagnostic accuracy studies (Bossuyt et al., 2015). Programmes that perform protocol biopsies gain a reference standard in recipients without clinical suspicion; those that do not must accept that subclinical rejection will be partly unobserved and say so.
3.5. Analysis of trajectories
The values are strongly right-skewed and are analysed on the logarithmic scale. The first aim is descriptive: a linear mixed model with a flexible function of time and random effects for each recipient gives the average curve and the spread of individual curves around it (Fitzmaurice et al., 2011). Donor type, delayed graft function and induction therapy enter as covariates. The second aim is to ask whether recipients fall into distinct groups, for instance those who reach a low plateau early and those who never do; group-based trajectory modelling was developed for that question (Nagin, 2005). The third aim relates the curve to outcomes. Because a recipient who rejects is treated, and treatment changes later values, the marker and the event cannot be analysed separately without bias. Joint models for longitudinal and time-to-event data address this by estimating both processes together (Rizopoulos, 2012). The analysis plan, including the definition of a meaningful within-person change, should be written before the data are examined.
4. Fitting the Design to a Transplant Programme
The design asks for little beyond organisation. Most draws coincide with blood tests the recipient would have in any case. The dense early sampling is the main added burden, and a programme that cannot afford every early assay can bank plasma and analyse a subset later. A single centre performing a moderate number of transplants each year will accumulate enough recipients to describe the average curve but probably too few rejection episodes to model them well, which argues for a shared protocol across centres using the same assay. Mixing assays within one analysis is unwise, since thresholds and units are not interchangeable. Consent should cover storage of plasma and linkage to registry outcomes beyond the first year.
5. Limitations and What Remains to Be Shown
This is a design on paper. Whether recipients and clinic staff will sustain the schedule, how much missing data will arise, and whether the early curve can be fitted reliably from the number of draws proposed are all unknown until the study is run. An observational design cannot show that acting on a trajectory improves graft survival; that requires a randomised comparison of surveillance strategies, and the large validation study by Aubert et al. (2024), while supporting the marker's association with rejection, does not settle the question of benefit either.
Two structural weaknesses should be acknowledged in advance. Without protocol biopsies, a recipient with a rising value and no biopsy has no reference diagnosis, and the analysis must treat that as missing information and not as absence of rejection. And where the treating team sees the results, their response to a high value alters what follows, so that the natural trajectory is observed only in recipients whose values gave no cause for concern.
6. Conclusion
Donor-derived cell-free DNA is ordered serially and interpreted serially, yet the published evidence is mainly about single values. The design proposed here would describe the first-year curve in unselected recipients, separate the steep early descent from the later plateau, and relate individual departures from the expected course to biopsy findings and outcomes, with attention to the confounders already documented. It remains a proposal until it is carried out, and its usefulness will depend on what the resulting curves turn out to show.
Conflict of interest
To be declared by the author(s) before publication.
Funding
To be declared by the author(s) before publication.