1. Introduction
Turmeric, the dried and ground rhizome of Curcuma longa, is among the most widely used spices in South Asian cooking and an article of international trade. Its value in the market is judged first by eye: a bright, saturated yellow is taken as a sign of quality, and the international specification for the spice includes a measure of colouring power (ISO, 1983). The colour comes from curcumin and related curcuminoids, whose content varies with cultivar, origin and processing. A pale lot can be made to look like a good one by adding a yellow colourant, and a good lot can be extended with a cheap filler. Both practices fall within what Spink and Moyer (2011) define as food fraud, deception for economic gain, and spices appear repeatedly in compilations of such incidents (Moore et al., 2012; Galvin-King et al., 2018).
With turmeric the fraud is also a health hazard. Investigations in Bangladesh found that lead chromate pigment was being added during the polishing of dried rhizomes to improve their colour (Forsyth et al., 2019a), and lead isotope evidence connected adulterated turmeric to the blood lead of rural residents (Forsyth et al., 2019b). Earlier work had already identified turmeric as a likely source of lead exposure for children in the same country (Gleason et al., 2014), and lead-contaminated ground turmeric has been reported in the United States market (Cowell et al., 2017). There is no known safe level of lead exposure in childhood, so detection at the point of sale has a direct public health purpose.
Handheld Raman spectrometers have become common in pharmaceutical raw material identification and in hazardous materials response (Crocombe, 2018), and they have been proposed for on-site detection of food fraud (Ellis et al., 2015). This review asks what the published evidence shows about their use on turmeric powder, and how far that evidence extends to the conditions of a local market.
2. Scope and Approach
The article is a narrative review. It considers published studies of turmeric adulteration and its health consequences, studies that applied Raman or related vibrational techniques to turmeric and to other spices, the foundational literature on the Raman methods concerned, and the chemometric literature on authentication models. No systematic search protocol was applied and no claim to completeness is made. The aim is to set out what is established, what is plausible but untested and what is unknown, with attention to the difference between laboratory demonstrations and field use.
3. Adulterants of Concern
The substances reported in turmeric fall into three groups. The first is inorganic yellow pigment, chiefly lead chromate, sold as chrome yellow for paints and plastics. It is intensely coloured, insoluble and cheap, and a small addition transforms the appearance of dull rhizomes (Forsyth et al., 2019a). The second is synthetic organic dye. Metanil yellow, a water-soluble azo dye that is not a permitted food colour, is the one most often associated with turmeric, and oil-soluble azo dyes of the Sudan family, better known from chilli products, have also been sought in it (Galvin-King et al., 2018). The third group is bulking material: starch from rice, maize or cassava, flour, spent turmeric from which the oleoresin has been extracted, and mineral powders such as chalk.
These groups differ in the amount added and in the nature of the harm. Fillers are used at high proportions and defraud the buyer without, in general, poisoning them. Colourants are used at low proportions and include the substances of real toxicological concern. Any screening technique has therefore to be judged separately for each group, and its performance for the colourants matters most.
4. Raman Signatures of Turmeric and Its Adulterants
Raman spectroscopy records the inelastic scattering of laser light by molecular vibrations and gives a pattern of bands characteristic of the compounds present. In turmeric the spectrum is dominated by curcumin, a strong scatterer whose most intense bands lie near 1600 and 1630 cm-1 and arise from the aromatic ring and the conjugated carbonyl and carbon-carbon stretching vibrations (Kolev et al., 2005). An adulterant is detectable when it contributes a band in a region where curcumin and the plant matrix are quiet, or when it changes the overall pattern in a way that a multivariate model can recognise. Table 1 summarises the position for the main adulterants.
| Adulterant | Purpose | Raman feature | Outlook for field screening |
|---|---|---|---|
| Lead chromate | Colour | Strong chromate stretching band -1 near 840 cm Bell et al., 1997 | Favourable at percentage level; particles unevenly distributed |
| Metanil yellow | Colour | -1 Azo-related band near 1406 cm Dhakal et al., 2016 | Shown in the laboratory at percentage level |
| Sudan-type dyes | Colour | Azo and ring bands close to those of curcumin | Poor without surface enhancement or extraction |
| Chalk | Bulk | Sharp carbonate band near 1086 -1 cm | Favourable |
| Starch and flour | Bulk | -1 Skeletal band near 478 cm ; weak scatterer | Only at high proportions |
| Spent turmeric | Bulk | No new band; lower curcumin signal | Uncertain; natural variation interferes |
The most direct evidence for the organic dye comes from the work of Dhakal et al. (2016), who examined mixtures of turmeric and metanil yellow by Fourier transform Raman and infrared spectroscopy and identified a metanil yellow band that could be followed in the mixture spectra at low percentage concentrations, with Raman the more sensitive of the two. A later study from the same group extended the approach to the authentication of turmeric powder using both modalities (Chao et al., 2020). For lead chromate, the spectroscopic basis is the well-known Raman spectrum of chrome yellow recorded in pigment libraries (Bell et al., 1997): the chromate ion scatters strongly, and its main band falls in a region where curcumin has little intensity. Rapid detection of lead chromate in turmeric has also been pursued with other portable techniques, notably X-ray fluorescence (Erasmus et al., 2021), which measures the lead directly and is the natural comparator for any Raman approach.
5. Instrumental Obstacles in the Field
The laboratory studies cited above used Fourier transform instruments with excitation at 1064 nm, and the choice was not incidental. Curcuminoids absorb in the visible and fluoresce strongly, and plant matrices add a broad background of their own. With the 785 nm lasers fitted to most handheld spectrometers, that fluorescence can exceed the Raman signal many times over. Handheld instruments with 1064 nm excitation exist and suppress the background, but their detectors are noisier and their signals weaker, so acquisition takes longer (Crocombe, 2018). Computational background removal, for example by iterative polynomial fitting (Lieber and Mahadevan-Jansen, 2003), improves the appearance of a spectrum but cannot restore information lost to the shot noise of an intense background.
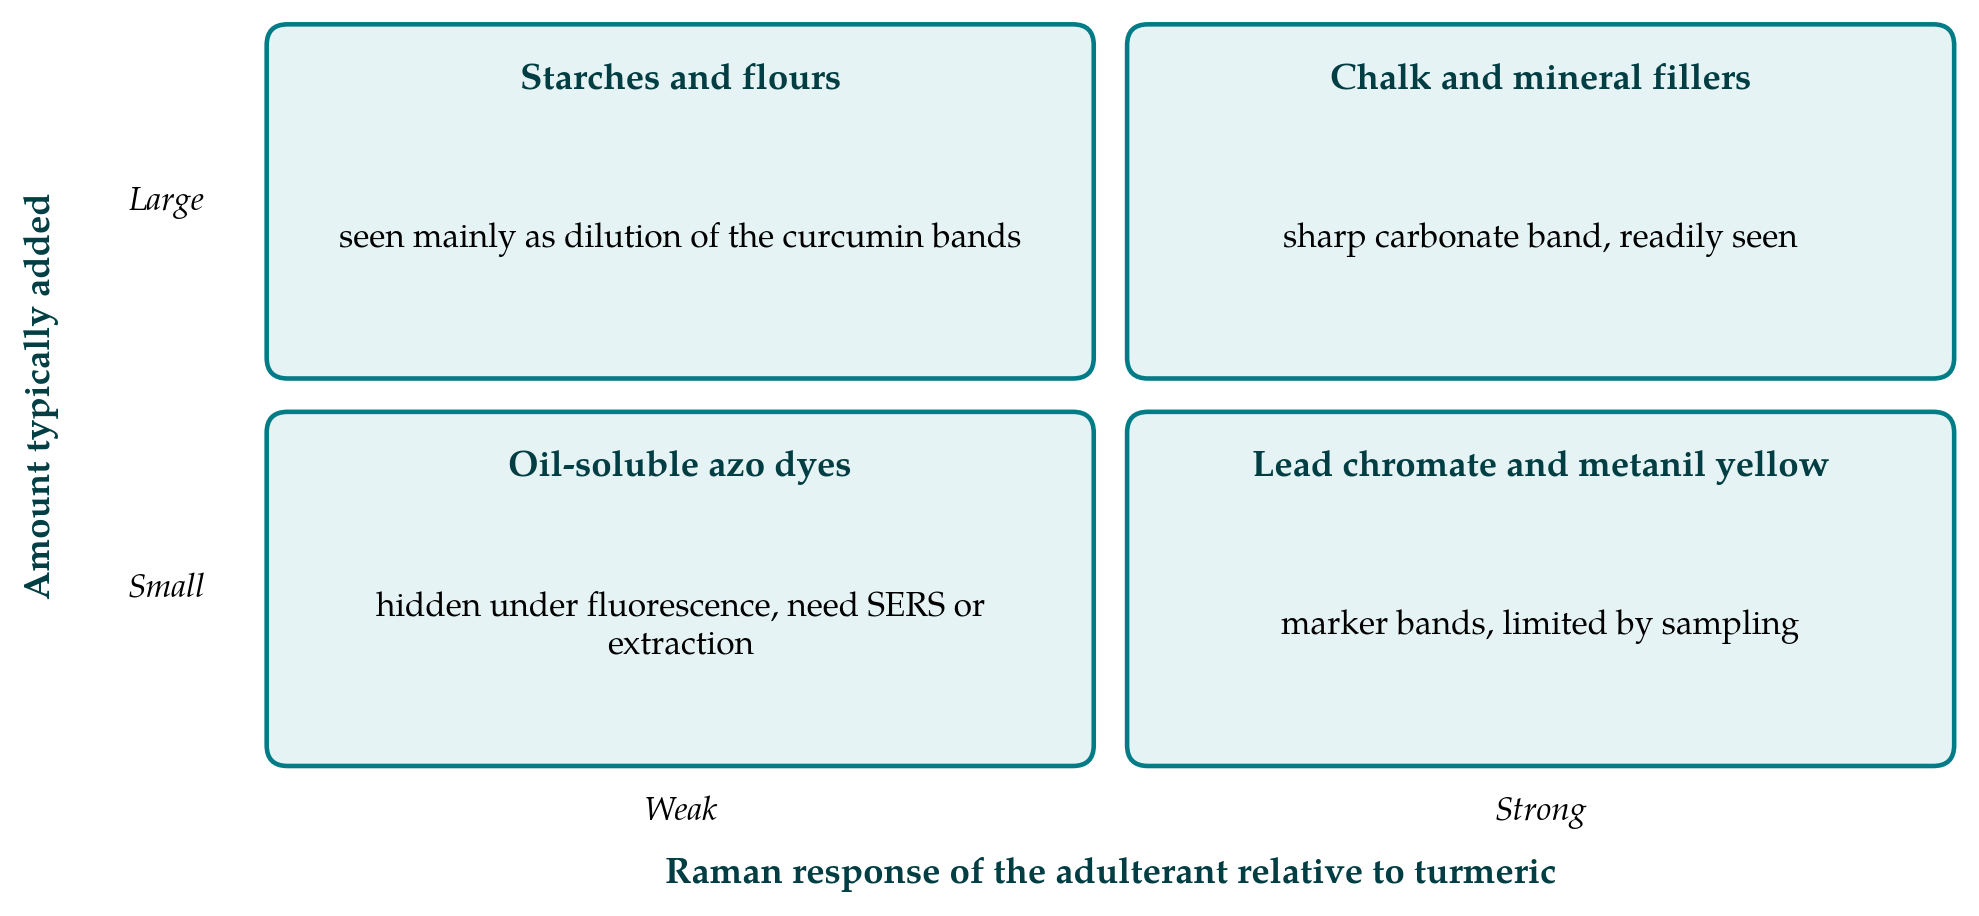
Two further difficulties follow from the sample. Turmeric is a coloured, absorbing powder, and a focused laser can heat and char it, which alters the spectrum and limits usable power. The laser spot is also small in relation to the scale of heterogeneity. Lead chromate is present as discrete pigment particles on and among the turmeric particles, so a single reading may strike a particle or miss it entirely. Averaging over several positions, rastering the beam or pressing the powder into a uniform surface reduces the problem, at the cost of time. Figure 1 places the adulterant groups according to the amount added and the strength of their Raman response, the two properties that together decide how hard each is to find.
6. Enhancement and Offset Techniques
Surface-enhanced Raman scattering, first observed for pyridine on roughened silver (Fleischmann et al., 1974) and now usually obtained with silver or gold colloids, raises the signal of molecules adsorbed on a nanostructured metal by many orders of magnitude and quenches fluorescence. It has been applied to the detection of Sudan dyes in culinary spices in combination with multivariate analysis (Di Anibal et al., 2012). For turmeric the approach would suit the dyes, which adsorb on metal surfaces, and not the insoluble pigment or the fillers. It also turns a point-and-shoot measurement into a small wet-chemical procedure, with a solvent extraction and a colloid whose batch-to-batch reproducibility is a known weakness.
Spatially offset Raman spectroscopy collects scattered light at a distance from the point of illumination and so favours signal from beneath a surface layer (Matousek et al., 2005). Handheld instruments based on the principle are used to identify materials through containers. For spices sold in sealed plastic packs this could allow screening without opening the pack, although published evaluations on turmeric were not identified in preparing this review.
7. From Spectra to Decisions
An inspector needs an answer, not a spectrum, and the conversion is made by a chemometric model. Spectra are first pre-processed, typically by smoothing and differentiation with the filters of Savitzky and Golay (1964), baseline correction and normalisation. Quantitative models for a known adulterant are usually built by partial least squares regression, and classification by its discriminant form (Barker and Rayens, 2003). Reviews of vibrational spectroscopy in food authentication show this pattern across many commodities (Lohumi et al., 2015).
Discriminant models have a structural limitation for market surveillance. They assign every sample to one of the classes on which they were trained, and so they recognise only the adulterants the modeller thought of. Rodionova et al. (2016) argue that authentication is properly a one-class problem: the model should describe genuine material and reject whatever falls outside it. Class-modelling methods such as SIMCA, introduced by Wold (1976), work in this way and have been reviewed for food authenticity claims by Oliveri and Downey (2012). Their demand is a training set that spans the genuine variation of turmeric across cultivars, origins, harvest years and particle sizes, and few published turmeric studies have assembled one.
Validation practice is the other weak point. Models built from one batch of turmeric spiked in the laboratory, and tested by cross-validation on the same mixtures, report performance that will not transfer to independent samples. Test sets should come from different lots and, ideally, from different instruments and days. Calibration transfer between handheld units of the same model is seldom examined, yet a surveillance programme would depend on it.
8. From the Laboratory to the Market
The literature reviewed above shows that the main turmeric adulterants have usable Raman features and that laboratory instruments can detect them in prepared mixtures at about the percentage level. That is a relevant level for fillers and for deliberate colouring with lead chromate, which is added in visible quantity. It is not sufficient for assurance of safety, because lead limits for spices are set at concentrations far below what any direct Raman measurement could reach. A negative Raman result therefore means that gross adulteration was not seen, and nothing more.
The realistic role of a handheld Raman instrument in a market is as a triage tool. A positive finding for a pigment or dye band justifies seizure of a sample and confirmatory analysis, by atomic spectrometry for lead and chromium or by liquid chromatography for dyes. In that role it competes with portable X-ray fluorescence, which is more sensitive for lead but blind to organic dyes, and with the simple colour tests long used by food inspectors. The comparative cost, speed and error rates of these options in actual inspection work have not, to the author's knowledge, been reported.
Sampling in a market raises practical questions that laboratory work does not. Loose turmeric is sold from open sacks and trays, and the surface layer may differ from the bulk through settling, handling and exposure to light. Packaged product carries a brand and a batch, while loose product carries neither, so a finding is hard to trace back along the supply chain unless the inspector records the vendor and the wholesaler at the time. Whole dried rhizomes, on which pigment sits as a surface coating, are a different sample again from powder and would need a measurement procedure of their own.
9. Gaps and Future Work
Four gaps stand out. Studies with handheld instruments, as distinct from benchtop Fourier transform systems, are few for turmeric. Studies on samples bought in markets, with adulteration confirmed by a reference method, are fewer still, so real-world rates of false alarms and missed cases are unknown. The natural variability of authentic turmeric has not been mapped spectroscopically on a scale that would support one-class models. And the sampling question, how many readings from how much powder are needed to find a particulate adulterant with stated confidence, has not been treated quantitatively. Each of these could be addressed by a field study designed with a reference laboratory, and the methods literature reviewed here indicates how such a study should be built and validated.
10. Conclusion
Portable Raman spectroscopy has a sound physical basis for detecting lead chromate, metanil yellow and mineral fillers in turmeric powder, because each contributes bands that stand apart from the curcumin spectrum. Fluorescence, heating, particle heterogeneity and the narrowness of existing chemometric models stand between that basis and dependable use at a market stall. The published evidence justifies treating the technique as a promising screen for gross adulteration that must be backed by confirmatory analysis, and it does not yet justify relying on it to declare turmeric safe.
Conflict of interest
To be declared by the author(s) before publication.
Funding
To be declared by the author(s) before publication.