1. Introduction
Diesel exhaust has been classified as carcinogenic to humans by the International Agency for Research on Cancer (IARC, 2014), and urban buses release it at street level, in the places where people wait, walk and live. New heavy-duty engines sold under current European rules are equipped with particulate filters as a matter of course (European Parliament and Council, 2009). Older buses are not, and because a bus chassis may run for fifteen years or more, fleets in many cities will include unfiltered vehicles for a long time unless something is done to them.
Retrofitting a diesel particulate filter is the principal option short of replacement. The technology is mature and has its own approval regulation (UNECE, 2014). Experience has nevertheless shown that a retrofit is not a component swap. The filter must regenerate, which depends on how the bus is driven; it collects incombustible ash, which must be removed; and it raises exhaust back-pressure, which the engine must tolerate. Each of these places demands on the workshop that did not exist before.
Operators considering a programme therefore need two things: a way of deciding which vehicles and which filter type will work, and a way of recording outcomes that allows an honest judgement afterwards. This article proposes a framework for both. It reports no fleet data. It is intended as a template that an operator or a transport authority could adopt and adjust.
2. Background
The framework rests on what is known about how filters behave and where retrofits go wrong. Three topics matter most: regeneration, ash and the side effects of catalysed systems.
2.1. Filtration and regeneration
A wall-flow filter is a ceramic honeycomb with alternate channels plugged at opposite ends, so that exhaust must pass through the porous walls. Soot is trapped first within the wall and then as a cake on its surface, and collection efficiency by mass is very high once the cake has formed (Konstandopoulos and Johnson, 1989). The pressure drop rises as soot accumulates (Konstandopoulos et al., 2000), so the soot has to be burned off. With oxygen alone this requires temperatures far above those in the exhaust of a bus in city traffic.
Two families of solution exist. Passive systems lower the temperature needed. The best known places an oxidation catalyst ahead of the filter to convert nitric oxide to nitrogen dioxide, which oxidises soot at much lower temperatures than oxygen does (Cooper and Thoss, 1989; Allansson et al., 2002); others coat the filter itself with catalyst (van Setten et al., 2001). Active systems raise the temperature when needed, by a fuel burner, electric heating or fuel dosed over a catalyst. Passive systems are simpler and cheaper but depend on the exhaust being hot enough for long enough, and on a sufficient ratio of nitrogen oxides to soot. A general account is given by Majewski and Khair (2006).
2.2. Ash, oil consumption and engine condition
Regeneration removes carbon. It does not remove the metallic residue of lubricating oil additives, chiefly compounds of calcium, zinc, magnesium and phosphorus, which remains in the filter as ash and gradually takes up channel volume (Sappok and Wong, 2007). Ash raises back-pressure and shortens the interval between regenerations, and it can be removed only by taking the filter off the vehicle and cleaning it. The rate of accumulation follows oil consumption, and an ageing engine with worn rings, valve guides or turbocharger seals consumes more oil than it did when new. Engine condition is therefore the first determinant of maintenance burden, ahead of anything to do with the filter.
2.3. Side effects and early fleet experience
Catalysed systems increase the fraction of nitrogen oxides emitted directly as nitrogen dioxide. Carslaw (2005) linked a rise in that fraction at London roadsides partly to the fitting of catalysed filters to buses, which shows that a retrofit can improve one pollutant while worsening another. On durability, the evaluation of continuously regenerating filters on New York City transit buses by Lanni et al. (2001) remains an instructive published example of a fleet trial with ultra-low-sulphur fuel, emissions testing and service records taken together. Particle emissions also need to be measured appropriately: filters remove solid particles very effectively, but the choice between mass, number and opacity as a metric affects what is seen (Kittelson, 1998; Giechaskiel et al., 2014).
3. The Proposed Framework
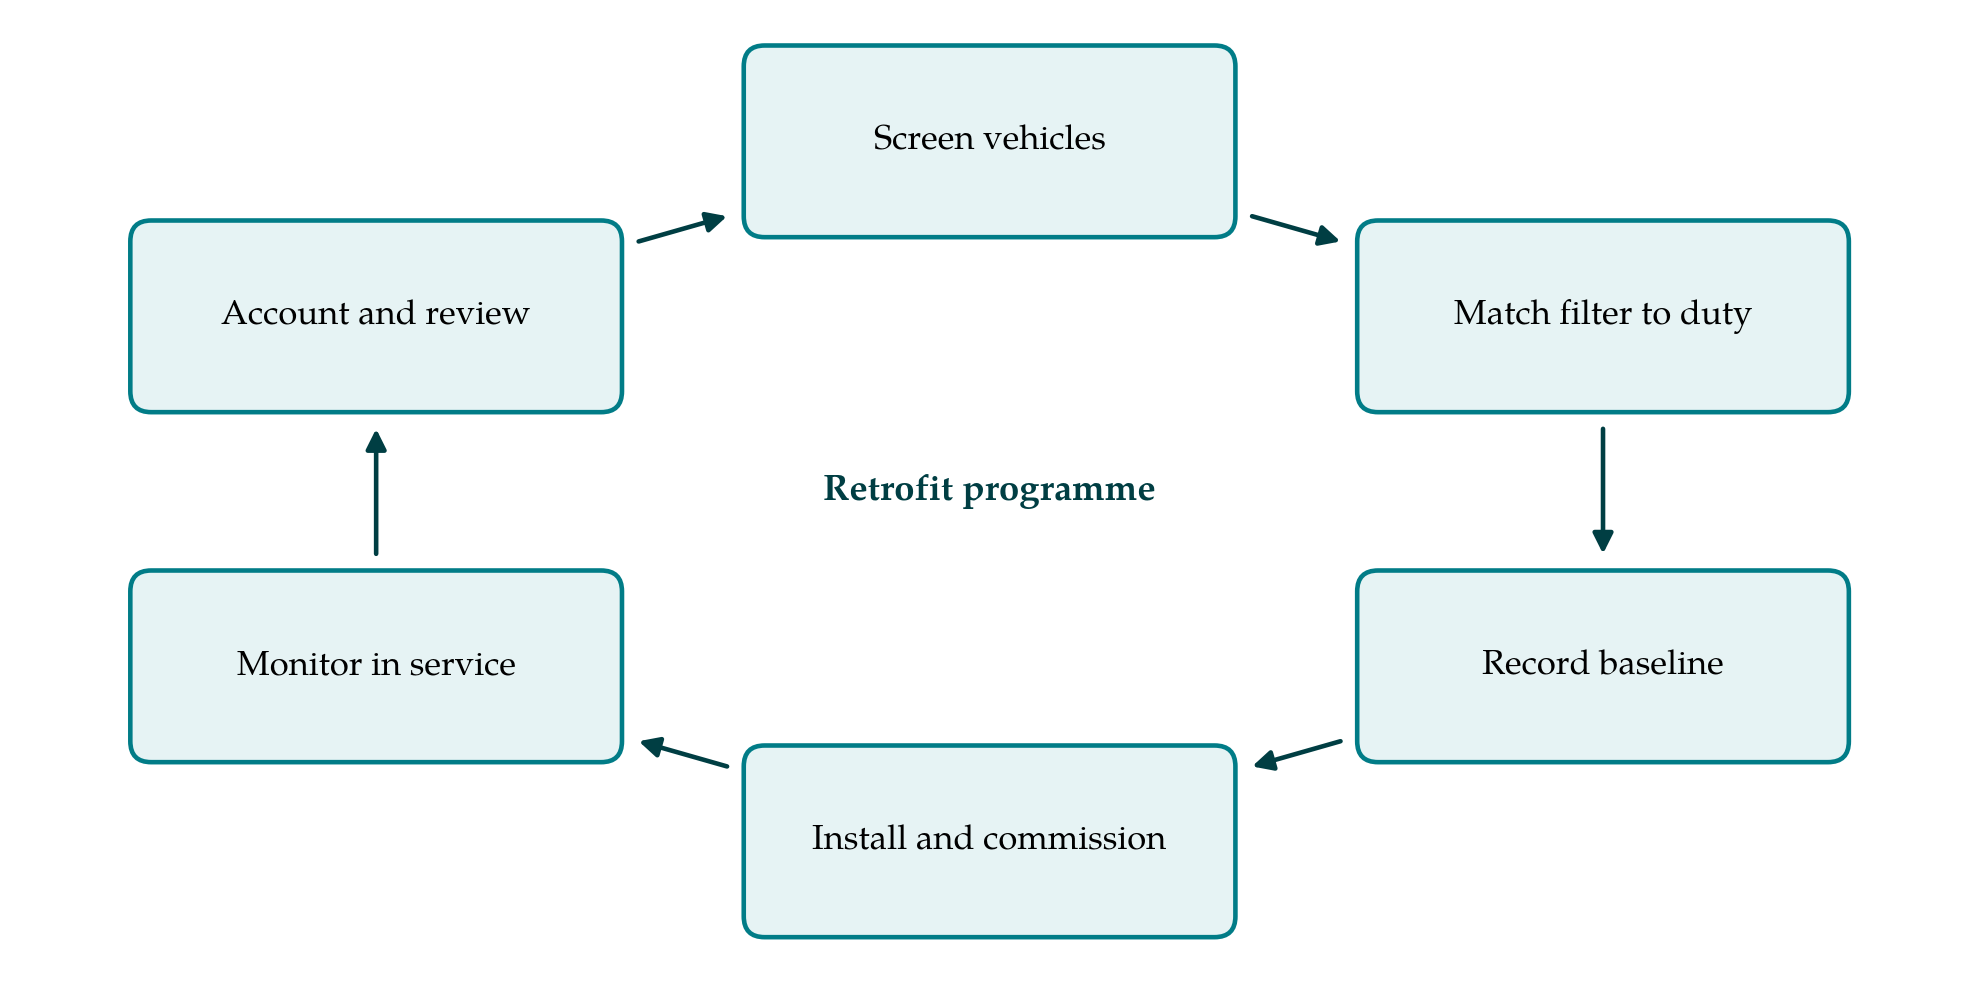
The framework has six stages, arranged as a loop in Figure 1 because the review at the end feeds the screening of the next batch of vehicles. The stages are described in order.
3.1. Stage 1: Screen the vehicles
Each candidate bus is assessed before any filter is ordered. The assessment covers remaining service life, since a filter fitted to a vehicle due for withdrawal will not repay its cost; oil consumption from top-up records over a defined distance; free-acceleration smoke opacity; turbocharger and injector condition; and any history of coolant loss into the cylinders. Vehicles with high oil consumption or heavy smoke are repaired first or excluded. The purpose of the stage is to prevent the filter from being used to conceal an engine fault that will destroy it.
3.2. Stage 2: Match the filter to the duty cycle
Exhaust temperature upstream of the proposed filter position is logged on representative vehicles, on their actual routes, for at least two working weeks. The record is reduced to the share of operating time spent above the temperature that the supplier specifies for passive regeneration. Urban bus cycles differ widely in speed, stop frequency and idling (Barlow et al., 2009), and a route with long idling and low speeds may never reach that share. Passive systems are assigned where the temperature profile supports them and active systems elsewhere. Fuel sulphur content and the lubricant specification are confirmed at this stage, because both affect catalyst performance and ash.
3.3. Stage 3: Record the baseline
Before installation, the indicators in Table 1 are recorded for each vehicle over a period long enough to cover seasonal variation in fuel use, ideally a full year from existing depot records. A subset of vehicles is given an emissions measurement by whatever method is available to the operator, whether a chassis dynamometer, a portable system or an opacity meter, with the method documented so that it can be repeated unchanged.
| Indicator | Definition | Data source |
|---|---|---|
| Particulate reduction | Change in tailpipe particle emission by a fixed test method | Emissions test before and after |
| Back-pressure trend | Peak exhaust pressure upstream of filter per day | On-board logger |
| Fuel consumption | Fuel used per distance, same route group | Fuelling and odometer records |
| Availability | Share of scheduled days the bus was fit for service | Depot allocation records |
| Filter-related road calls | In-service failures attributed to the filter system | Breakdown reports |
| Cleaning interval | Distance between ash cleaning events | Workshop job cards |
| Maintenance labour | Workshop hours booked to the filter system | Job cards with a dedicated code |
| Maintenance cost | Parts, cleaning services and labour per distance | Stores and accounts records |
3.4. Stage 4: Install and commission
Installation follows the supplier's instructions, with attention to the distance from the turbocharger, insulation of the pipework and the absence of leaks ahead of the filter. Every vehicle receives a back-pressure sensor and a temperature sensor connected to a logger and to a driver warning lamp. The clean-filter back-pressure at a defined engine speed is recorded as the reference against which later readings are judged. Drivers and workshop staff are briefed on what the warning means and on what must not be done, in particular continuing to operate with the lamp lit.
3.5. Stage 5: Monitor in service
Logged back-pressure and temperature are downloaded at each routine service and plotted against distance. A rising trend that does not fall back after regeneration indicates ash and schedules a cleaning; a sudden rise indicates failed regeneration and prompts inspection of the engine and the route allocation; a sudden fall indicates a cracked or melted substrate. Maintenance on the filter system is booked to a dedicated job code so that its labour and parts can be separated from other work. Without that separation the maintenance burden cannot be measured at all.
3.6. Stage 6: Account and review
At fixed intervals the indicators are compiled and compared with the baseline. Two points of method apply. First, a simple before-and-after comparison is vulnerable to changes that affect all buses, such as a new timetable or a change of fuel supplier. Where the retrofit is phased, vehicles not yet fitted serve as a comparison group over the same period, a design discussed by Shadish et al. (2002). Second, cleaning intervals and filter failures are time-to-event data, many of them incomplete at the time of review because the filter is still in service. They should be analysed with methods that handle such censoring (Meeker and Escobar, 1998), not by averaging the events that happen to have occurred. The review then informs maintenance intervals in the manner of reliability-centred maintenance (Moubray, 1997) and the screening rules for the next batch.
4. Fitting the Framework to an Operator
A large municipal operator with its own engineering staff can apply every stage. A small operator may lack loggers and emissions equipment, and the framework can be reduced without losing its logic: screening by oil records and opacity, a short temperature survey with borrowed instruments, a warning lamp on every bus and a dedicated job code. What should not be dropped is the baseline. An operator that begins recording only after installation will have no way of showing what the programme changed. Where a transport authority funds the retrofit, making the baseline and the indicator set a condition of funding gives it comparable results from every operator.
5. Limitations and What Remains to Be Shown
The framework is a proposal and has not been tested on a fleet here. Its thresholds are deliberately left to the supplier and the operator, because acceptable oil consumption, regeneration temperature and back-pressure depend on the engine and filter concerned, and that leaves room for inconsistent application. The indicator set measures emissions at the tailpipe and does not extend to roadside concentrations or health, which lie beyond what depot records can show. Attribution of a road call or a fuel consumption change to the filter involves judgement, and a phased comparison group is not a randomised one.
What would need to be shown is that the screening and matching stages do reduce early filter failures compared with unscreened fitting, and that the indicator set can be collected at acceptable cost in an ordinary depot. Both questions can be answered only by operators who apply the framework and publish what they find, including the programmes that went badly.
6. Conclusion
Particulate filters can make old buses far cleaner, but the outcome depends on engine condition, on the fit between regeneration method and route, and on maintenance that the fleet did not previously need. The six-stage framework proposed here puts those dependencies into the planning of a programme and attaches a small, defined set of indicators so that operational outcomes and maintenance burden are recorded on the same footing before and after. Its usefulness remains to be established in practice.
Conflict of interest
To be declared by the author(s) before publication.
Funding
To be declared by the author(s) before publication.