1. Introduction
A clickstream classifier assigns a label to a session or an event as it happens: likely to buy, likely to abandon, human or automated. The data are non-stationary by nature. Site redesigns move links, campaigns bring new audiences, seasons alter what people look for, and crawlers change their signatures. Widmer and Kubat (1996) described the resulting loss of validity of a learned model as concept drift, and the literature since has produced many methods for detecting and adapting to it (Gama et al., 2014; Lu et al., 2019).
Clickstream settings place two particular demands on a detector. Labels are delayed, since a purchase may follow a session by days and a bot may never be confirmed, and event rates are high, with traffic split across many stream partitions. This note considers how far compact statistical sketches, which stream processors already maintain for analytics, can serve as the detector's input.
2. Why Standard Detectors Fit Poorly
The classical detectors monitor the model's errors. The drift detection method of Gama et al. (2004) tracks the running error rate and signals when it rises significantly above its recorded minimum. ADWIN keeps a window of recent values and shrinks it whenever two sub-windows differ in mean by more than a bound derived from the Hoeffding inequality (Bifet and Gavaldà, 2007). The cumulative sum test of Page (1954) remains a common choice for the same purpose. All three need a stream of correct-or-incorrect outcomes, and in a clickstream that stream runs days behind the traffic it describes.
The alternative is to watch the inputs. Kifer et al. (2004) framed change detection as a two-sample test between a reference window and a current window of unlabelled data. Applied literally, this means retaining raw windows for every feature, which is expensive at high volume, and it sits uneasily with partitioned processing, where no single worker sees the whole window. What is wanted is a summary that is small, updatable one event at a time and combinable across workers.
3. Sketches as Drift Signals
A sketch is a compact, approximate summary of a stream with a stated error guarantee. The property that matters most here is mergeability: summaries built separately over two parts of a stream can be combined into a summary of the whole with no loss of guarantee (Agarwal et al., 2013). A reference sketch can then be assembled from many partitions and many past intervals, and a current sketch from the most recent ones. Table 1 lists the three families of sketch that suit clickstream features and the drift statistic each supports.
| Sketch family | Summarises | Drift statistic | Caveat |
|---|---|---|---|
| Quantile sketch (Greenwald and Khanna, 2001; Karnin et al., 2016) | Numeric features; classifier scores | Largest gap between reference and current distribution functions | Sketch error must be well below the alarm threshold |
| Count-min sketch (Cormode and Muthukrishnan, 2005) | Frequencies of pages, referrers, agents | Divergence between estimated frequency vectors of popular values | Overestimates rare values; weak in the tail |
| HyperLogLog (Flajolet et al., 2007) | Number of distinct values | Relative change in distinct count per window | Sees new values, not shifts among old ones |
| Counters and moments | Event rate; mean and variance | Standardised difference of means | Blind to changes of shape |
| Per-class score sketches | Scores, split by predicted label | Shift in predicted class proportions | Reflects the model as well as the data |
For a numeric feature, such as dwell time or pages per session, a quantile sketch answers rank queries within a small additive error. Evaluating the reference and current sketches on a common grid of values gives two approximate distribution functions, and their largest difference is an estimate of the Kolmogorov-Smirnov statistic. The same construction applied to the classifier's output score is especially useful, since the score compresses all features into the one direction the model cares about. For a categorical feature, a count-min sketch returns frequency estimates that never fall below the truth and exceed it by a bounded amount, which is adequate for the popular values that dominate a divergence measure. A cardinality sketch adds a different signal: a sudden rise in the number of distinct user agents or landing pages often marks a crawler or a campaign before any distribution has visibly moved.
4. A Monitoring Loop
These statistics can be organised into a loop of six steps, shown in Figure 1. Each stream worker updates its sketches as events pass. At the end of a tumbling window the workers' sketches are merged and compared with a reference built from a period in which the model was known to perform acceptably. A statistic that crosses a lower threshold raises a warning; one that crosses a higher threshold, or stays at warning level for several consecutive windows, raises an alarm. The two-level scheme follows the practice of the error-based detectors.
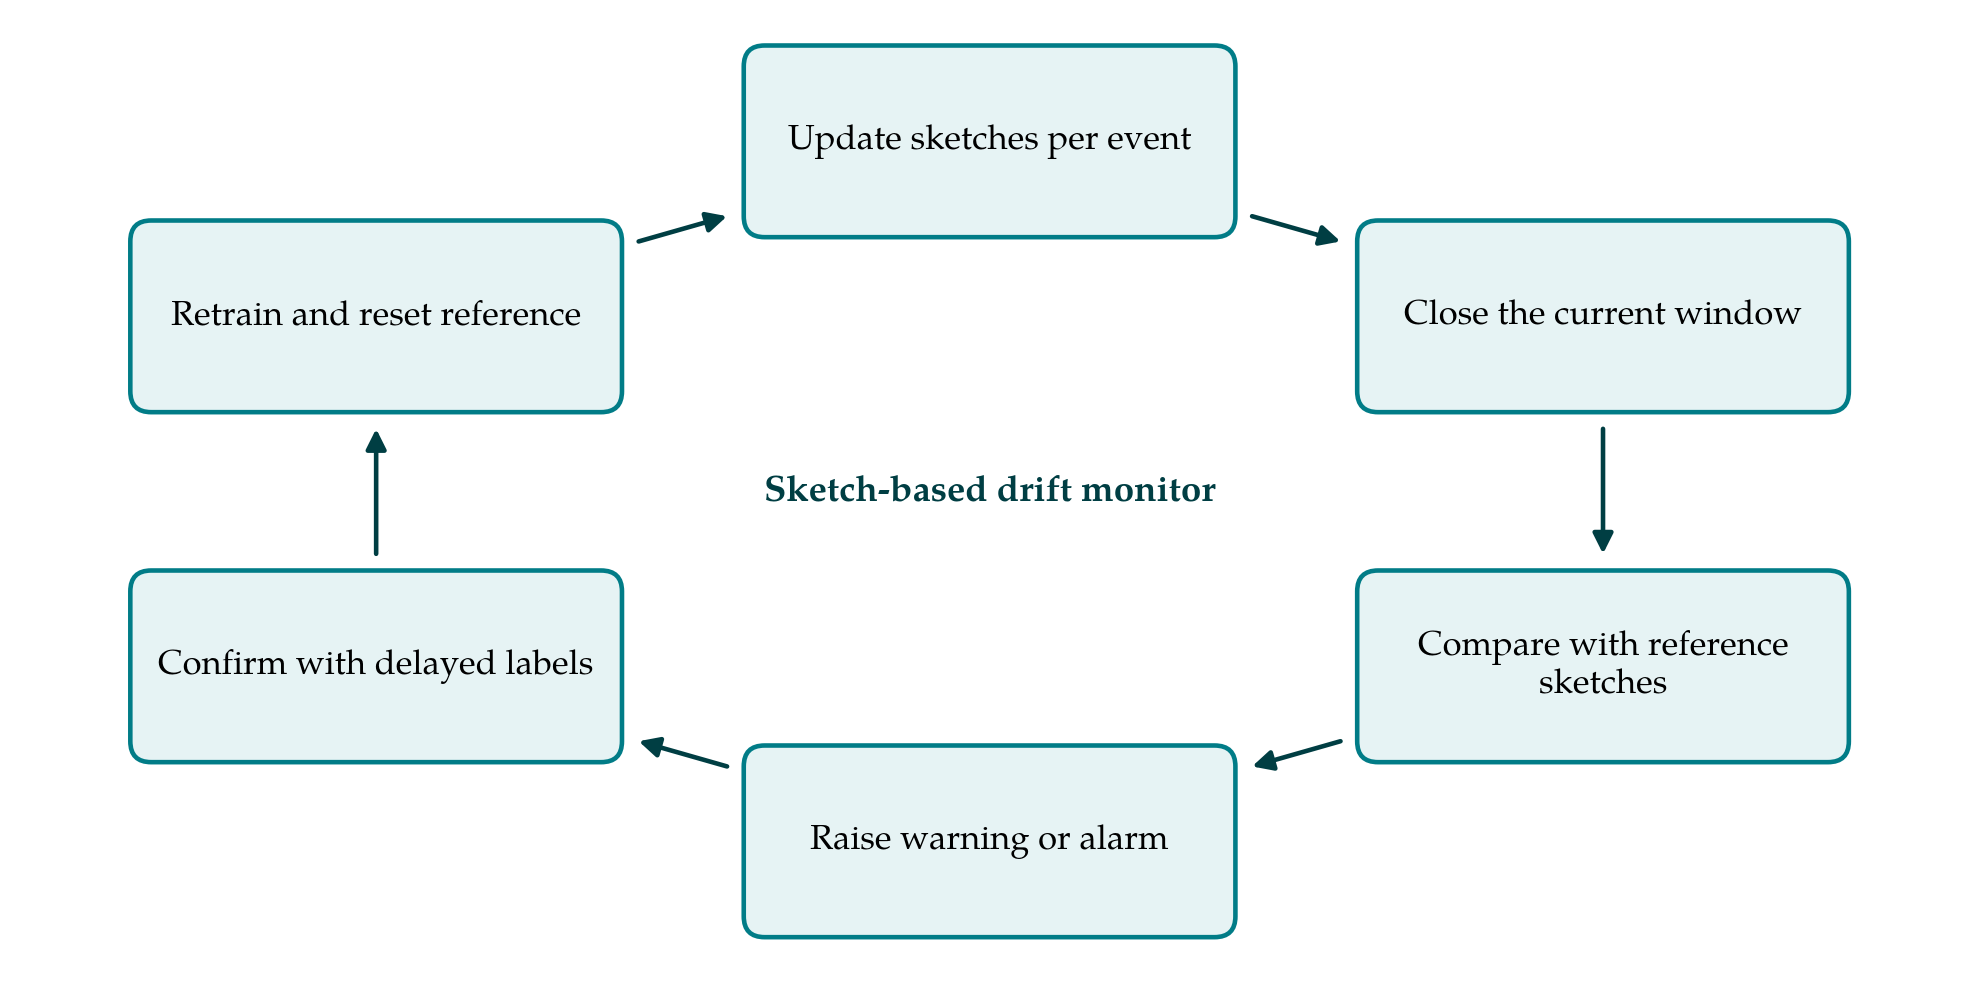
An alarm from unlabelled data is a prompt and not a verdict. Feature distributions shift for reasons that leave accuracy intact, and retraining at every alarm would waste effort and could destabilise the model. The loop therefore includes confirmation: when labels for the flagged period mature, an error-based test such as ADWIN is run over them, and only a confirmed alarm triggers retraining and replacement of the reference sketches. Unconfirmed alarms are logged and used to adjust the thresholds. Because many features are tested in every window, some correction for multiple comparisons is needed, and thresholds should account for the sketches' own approximation error so that it is not mistaken for change.
5. Limits of the Approach
Three limits should be stated plainly. Sketches of individual features capture marginal distributions. A change in the dependence between features, with each marginal unchanged, passes unseen unless the classifier score happens to register it. More fundamentally, monitoring inputs detects a change in the distribution of the features and cannot detect a change in the conditional distribution of the label given the features, which the survey literature calls real concept drift (Gama et al., 2014). If customers with the same browsing pattern begin to buy less, only labels will show it. Sketch-based monitoring shortens the time to notice the first kind of change and does nothing for the second.
The third limit is practical. Window length, reference period and thresholds interact, and clickstreams have strong daily and weekly cycles that a naive comparison will report as drift every morning. Comparing a window with the same hour of earlier weeks is the obvious remedy, at the cost of keeping more reference sketches. How well any particular configuration separates harmful change from routine variation is an empirical question that this note does not answer. It should be examined on labelled clickstream data with changes of known timing before the approach is relied on.
6. Conclusion
Quantile, frequency and cardinality sketches give clickstream systems an inexpensive, mergeable view of how inputs and model scores are distributed, and comparing current sketches with a reference yields drift statistics long before labels arrive. Used as an early-warning layer in front of label-based confirmation, they fit the constraints of high-volume, partitioned streams. They do not replace labelled evaluation, since the form of drift that matters most to a classifier is the one unlabelled data cannot reveal.
Conflict of interest
To be declared by the author(s) before publication.
Funding
To be declared by the author(s) before publication.