1. Introduction
Krackhardt and Hanson (1993) called the informal network the company behind the chart and argued that managers who could not see it would misjudge how work got done. A decade later Cross et al. (2002) showed, through network surveys in a series of organisations, that the individuals on whom colleagues depended for information were often invisible to senior management and that some were so heavily consulted as to have become bottlenecks. For knowledge management the point is practical. An organisation that does not know who its informal experts are cannot plan for their departure, cannot relieve them when they are overloaded and cannot direct newcomers to them.
The difficulty is one of measurement. The network survey that produced those findings asks each member of a group to rate relations with each other member. It works for a department and becomes impractical for a division. Digital collaboration tools have meanwhile made it possible to observe interaction across a whole organisation without asking anyone anything, and the temptation is to treat frequency of contact as a measure of expertise. This article argues that neither instrument is adequate alone and proposes a way of combining them. The procedure is put forward as a design for others to test. No application of it is reported.
2. Background
Three bodies of work inform the design: the theory of how people come to know who knows what, the record of what survey measures of networks can be trusted to show, and the more recent experience with digital trace data.
2.1. Expertise as a relational property
Wegner (1987) introduced the idea of transactive memory: a group remembers more than its members individually because each knows which of the others holds what. Lewis (2003) developed a field measure of such systems built on specialisation, credibility and coordination. The implication is that expertise, for organisational purposes, lies in being recognised and consulted as well as in what a person knows. Borgatti and Cross (2003) specified the conditions under which one person seeks information from another: knowing what the other knows, valuing it, being able to gain timely access and judging the cost of asking to be acceptable. A map of expertise must therefore capture a directed relation, from the person who asks to the person who is asked, and should distinguish the topic.
2.2. What surveys measure well and badly
Survey measurement of networks has a known weakness. Bernard et al. (1984) reviewed studies comparing reported with observed communication and concluded that informants' accounts of whom they had interacted with over a given period were seriously inaccurate. Marsden (1990), surveying network measurement more broadly, noted that respondents report stable, typical relations better than specific episodes, and that recognition from a list yields more complete data than free recall. Surveys are thus poor at recording the volume and timing of contact and comparatively good at recording judgements, such as whom one regards as an authority. Their other limitation is burden. A roster covering every colleague grows with the square of group size, and response rates suffer.
2.3. What digital traces measure well and badly
Trace data reverse this profile. Digital systems keep records of interaction as a by-product, and organisational researchers have used such records to study structure at a scale no survey could reach (Yang et al., 2022). Comparisons of the two sources are instructive. Quintane and Kleinbaum (2011) and Wuchty and Uzzi (2011) each compared e-mail records with self-reported ties and found a real but partial correspondence: traces recover the relations people report, but they also contain much routine contact that respondents do not regard as a relationship. Traces record that an exchange took place. They are silent on whether it was a request for advice, an instruction or an administrative notice, and they omit whatever happens face to face.
3. Overview of the Proposed Design
The design assigns to each source the task it performs well. Table 1 sets the sources side by side. Metadata establish who is in regular two-way contact with whom, across the whole population, at no cost in respondents' time. That structure is then used to shorten the survey. Each respondent is shown a brief list of colleagues, drawn mainly from those with whom the metadata indicate regular contact, and is asked a small number of questions about whom they consult. Recognition replaces recall, the roster shrinks from hundreds of names to a dozen or so, and the survey can be repeated.
| Source | What it captures | Characteristic weakness | Role in the design |
|---|---|---|---|
| E-mail metadata | Sender, recipients and time of each message | Much routine and broadcast traffic | Base layer of dyadic contact |
| Calendar metadata | Who attends meetings with whom | Large meetings imply no real tie | Supplement, small meetings only |
| Chat and channel metadata | Direct messages and replies in shared channels | Use varies greatly between teams | Supplement; replies show who answers |
| Document co-editing | Joint work on the same files | Sparse outside some functions | Optional evidence of joint work |
| Pulse survey | Whom the respondent consults, and on what | Recall error and respondent burden | Meaning layer on a prompted short list |
| Validation sessions | Whether the map is recognised as accurate | Small groups, not exhaustive | Check before any reporting |
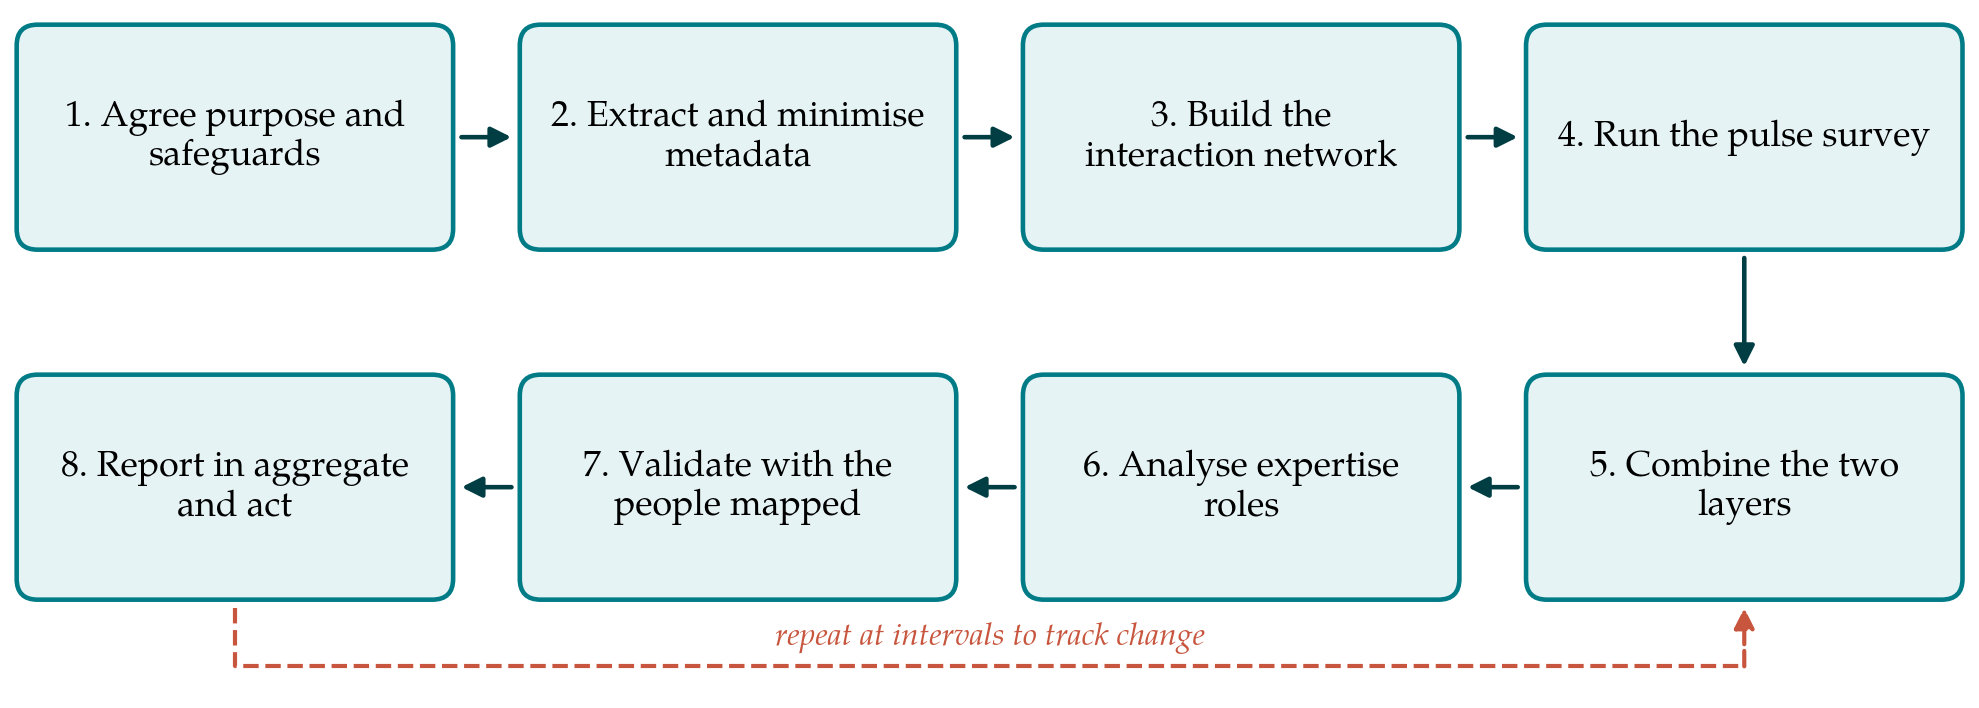
Figure 1 shows the eight steps in sequence. They are described below with the judgement each requires.
4. The Procedure Step by Step
The steps are written for an organisation of several hundred to a few thousand staff with a common collaboration platform. Smaller groups can use the survey alone.
4.1. Step 1: Agree purpose and safeguards
The exercise begins with a written statement of purpose, which should be limited to understanding and supporting the flow of expertise and should exclude the appraisal of individuals. Employee representatives and the data protection officer are consulted before any data are drawn. Within the European Union the General Data Protection Regulation applies: the principles of purpose limitation and data minimisation in Article 5, the need for a lawful basis under Article 6, and the data protection impact assessment required by Article 35 for processing likely to result in a high risk (European Union, 2016). Borgatti and Molina (2005) observed that network studies in organisations cannot offer anonymity in the usual sense, since the data consist of named relations, and recommended an explicit agreement with management on what will be disclosed and to whom. Such an agreement is made here.
4.2. Step 2: Extract and minimise metadata
Only header information is extracted: pseudonymised identifiers of sender and recipients, a timestamp and the channel. Message bodies, subject lines and attachments are never accessed. A recent window of some months is taken, long enough to smooth over holidays and project peaks. Messages to large distribution lists, automated notifications and meetings above a small size are removed, because they signify no relation between the parties. The key linking pseudonyms to persons is held separately by a custodian who is not an analyst.
4.3. Step 3: Build the interaction network
The cleaned records are reduced to counts of contact between each pair of people. A tie is retained only where contact is reciprocated and recurs across several weeks, a filter intended to remove the routine traffic that the comparison studies found to be unrelated to reported relationships (Wuchty and Uzzi, 2011). The thresholds are set after inspecting the distributions and are recorded. The result is an undirected, weighted network of working contact. It says nothing yet about expertise.
4.4. Step 4: Run the pulse survey
Each participant receives a short questionnaire listing the colleagues with whom the network shows regular contact, with space to add others. Two or three questions follow, adapted from the information and advice items used in organisational network surveys (Cross and Parker, 2004): to whom the respondent turns when stuck on a problem in a named domain, whose judgement the respondent would want before a consequential decision, and, optionally, who has helped the respondent to learn the job. Domains are chosen with the business in advance and rotated between waves so that no single wave is long. Participation is voluntary, and a respondent may decline to be included in the map as a nominee.
4.5. Step 5: Combine the two layers
Survey nominations are directed ties labelled by domain. They are laid over the interaction network. Three kinds of tie result: those present in both layers, which are the best attested; nominations with no trace in the metadata, which usually indicate advice sought in person; and frequent contact without nomination, which indicates coordination and not expertise. Keeping the three distinct is the main analytical gain over either source alone.
4.6. Step 6: Analyse expertise roles
Standard measures are then applied to the directed advice layer (Wasserman and Faust, 1994). In-degree, the number of colleagues who name a person, identifies recognised experts in each domain. Betweenness, in the sense defined by Freeman (1978), identifies those who connect groups that would otherwise not reach one another, the brokers who span what Burt (1992) called structural holes. Community detection on the interaction layer, for which the method of Blondel et al. (2008) is widely used, shows clusters of working contact, and comparing them with the advice ties reveals groups that depend on a single outside expert or that consult nobody beyond themselves.
4.7. Step 7: Validate with the people mapped
Before anything is reported, the patterns are shown to small groups drawn from the population and they are asked whether the map matches their experience. This step guards against artefacts of the thresholds and catches experts whom neither layer has registered, such as a long-serving technician consulted entirely by word of mouth. It also honours an obligation: people whose relations have been charted are entitled to see what has been made of them.
4.8. Step 8: Report in aggregate and act
Reports to management are aggregated to units and domains. Individuals identified as heavily consulted are told so privately and are named to management only with their consent. Small groups are suppressed or merged, following the reasoning of Sweeney (2002) that a record is protected only when it cannot be distinguished from a sufficient number of others. Actions that the map may support include pairing an overloaded expert with a successor, introducing isolated groups to relevant experts and recording knowledge held by a single person. The exercise is repeated at intervals, since networks shift with projects and staffing.
5. Interpreting the Map With Care
A network diagram invites over-reading. A person with few incoming ties may be new, may work in a specialism that few others need, or may be consulted by clients and not by colleagues. A person with many may be an expert or merely the only one who answers messages. Relational measures add to what can be seen of an organisation, and the same property makes them easy to misuse, because they appear to rank people. The procedure is built to describe a system and the safeguards in Steps 1 and 8 exist to keep it from being turned into an instrument of individual assessment, which would destroy the candour on which the survey depends.
6. Limitations and What Remains to Be Shown
The procedure has not been validated here. Its central assumption, that prompting from metadata produces a more complete and less burdensome account of advice ties than an unprompted survey, is testable: in a group small enough for a full roster survey, the prompted short list can be compared with the complete one. A second open matter is bias in the prompt. Colleagues consulted only in person will not appear on the list, and although respondents may add names, recognition is easier than recall and the map may favour those who are active on the platform. A third is stability, since the thresholds in Step 3 are judgements and their effect on the results should be reported.
Legal and cultural limits also apply. Rules on the monitoring of employees differ between jurisdictions, and in some the use of communication metadata will require agreement with a works council or will not be permitted. Where trust between staff and management is low, the survey alone, without the metadata layer, may be the only acceptable form.
7. Conclusion
Informal expertise is a relation between people who ask and people who are asked, and no single instrument observes it well. Collaboration metadata show structure without meaning; surveys supply meaning at a cost that limits their reach. The procedure proposed in this article joins them, using traces to keep the survey short and the survey to say what the traces signify, within explicit limits on purpose and disclosure. It remains to be tested, and the tests required are within the means of any organisation prepared to try it on a small group first.
Conflict of interest
To be declared by the author(s) before publication.
Funding
To be declared by the author(s) before publication.