1. Introduction
The purity of a synthetic intermediate governs the yield that can be claimed for a step and the stoichiometry of the step that follows, yet it is often estimated from a chromatogram, which reports an area percent that need not equal a mass percent because different compounds absorb or ionise differently. Quantitative proton nuclear magnetic resonance, abbreviated qNMR, offers a more direct route. The area of a resonance is proportional to the number of protons giving rise to it, with a proportionality constant that is the same for every proton in a spectrum acquired correctly, so the ratio of two areas is the ratio of two molar quantities of protons without the need for a compound-specific response factor (Malz and Jancke, 2005; Pauli et al., 2005). The principle is old: a proton spectrum was used to quantify the components of an analgesic mixture by Hollis (1963).
The customary way to turn that ratio into an absolute amount is to add an internal standard, a pure compound of known mass whose protons are counted against the analyte's. Benzoic acid, dimethyl terephthalate, maleic acid and 1,3,5-trimethoxybenzene are common choices, the properties that make a good internal standard having been surveyed by Rundlof et al. (2010), and certified reference materials for the purpose are available (Weber et al., 2015). The internal standard is accurate and simple, but it must dissolve in the same solvent, stay chemically inert toward the analyte, and show at least one signal clear of every analyte resonance. For a precious intermediate the method also consumes sample and contaminates the recovered material.
These constraints have encouraged references that are not mixed with the sample. This article proposes a stepwise procedure for assigning the purity of synthetic intermediates by proton qNMR without an internal standard. It gathers the external-reference options into one workflow, states the assumptions each makes, and describes the acquisition and processing needed for areas to mean what the calculation requires. The procedure is a proposal built from theory and published method; it reports no measurements of its own and has not been validated here.
2. Background
Two bodies of knowledge underlie the method: the conditions that make a proton spectrum quantitative, and the ways a reference can be supplied from outside the sample. The pharmaceutical applications of the technique are reviewed by Holzgrabe (2010).
2.1. What makes a proton spectrum quantitative
A spectrum is quantitative when every proton is excited equally and has returned to equilibrium before the next scan, so that area tracks concentration. In practice this means a ninety-degree or calibrated pulse applied uniformly across the spectral width, a relaxation delay long enough that the interval between pulses reaches about five times the longest spin-lattice relaxation time of the protons being integrated, and proton decoupling that avoids the nuclear Overhauser enhancement which inverse-gated schemes are designed to suppress (Bharti and Roy, 2012). The signal-to-noise ratio must be high enough that integration is not limited by noise, and thirteen-carbon satellites, which carry about half a percent of the area on each side of a strong singlet, should be counted or suppressed. The requirements and their justification are set out in the method standards and reviews (Malz and Jancke, 2005; Giraudeau, 2014).
2.2. References supplied from outside the sample
An external reference sidesteps contact with the analyte. The oldest form is simply a separate sample of a standard of known concentration measured under identical conditions, the area then scaled by the ratio of receiver gain, number of scans and sample volume; its weakness is that any drift between the two acquisitions appears directly in the result. A coaxial insert places the reference in a sealed capillary inside the sample tube, so analyte and reference are measured at once, at the cost of a known small volume that the capillary displaces and a susceptibility step at the glass wall. The electronic route, introduced as ERETIC by Barantin et al. (1997) and in its later, more robust form as a synthesised reference signal calibrated against a known sample (Akoka et al., 1999), adds an artificial peak of calibrated area to the spectrum, so no physical reference is present at all. The use of such external referencing to measure an absolute concentration is illustrated for proteins by Wider and Dreier (2006).
3. The Proposed Procedure
The procedure has six steps, listed in Table 1 with the output of each and shown in sequence in Figure 1. The steps are described in turn below. Throughout, the number of protons per molecule for the integrated multiplet must be known from the structure, which for a synthetic intermediate of defined constitution is the usual case.
| Step | What is done | Output |
|---|---|---|
| 1. Choose route | Select external, coaxial-insert or electronic reference by sample value and matrix | Chosen reference mode and its assumptions |
| 2. Prepare and lock | Weigh sample and solvent, dissolve fully, lock and shim | Recorded masses, a homogeneous locked sample |
| 3. Acquire | Calibrate pulse, set relaxation delay, acquire with inverse-gated decoupling | A quantitative free induction decay |
| 4. Process | Phase, correct baseline, integrate chosen multiplets and satellites | Reliable areas per proton |
| 5. Compute | Convert areas to analyte amount, then to mass fraction by mass balance | Assigned purity as a mass fraction |
| 6. State limits | Combine uncertainty components; note what the value excludes | Purity with an uncertainty and caveats |
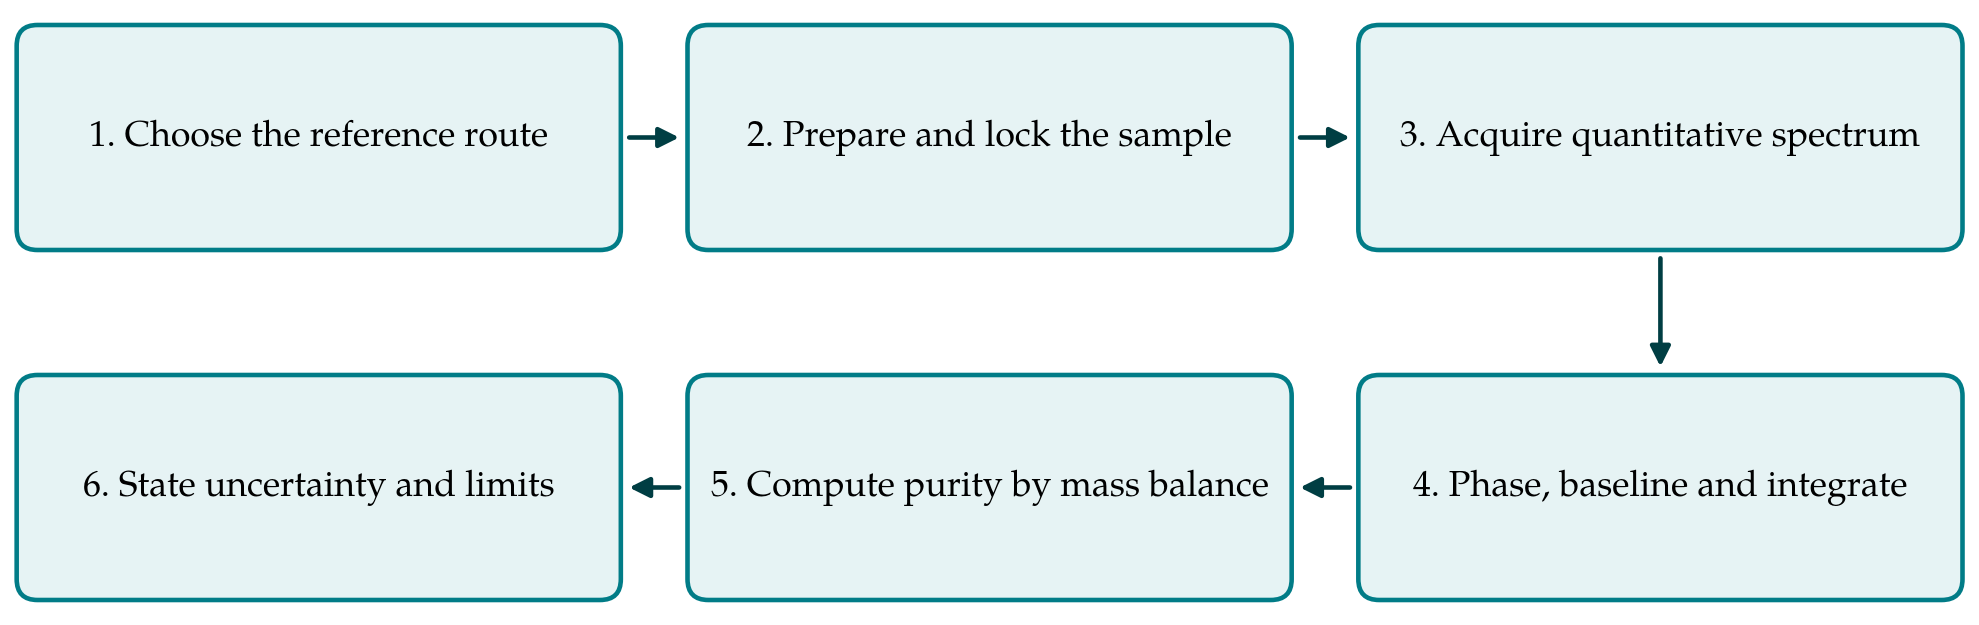
Step one is the choice of route. Where the sample can spare a few milligrams and no contamination matters, an internal standard remains the most accurate option and should be preferred; the external routes are for when it cannot. A coaxial insert suits a stable reference and a sample whose spectrum is crowded, since the reference peak can be placed in a clear region by choosing the reference compound. The electronic route suits the smallest samples and automated runs but depends wholly on the calibration holding between that calibration and the measurement.
3.1. Step 2: Prepare and lock the sample
The sample is weighed on a balance whose calibration is current, dissolved completely in a measured quantity of deuterated solvent, and inspected for undissolved particles, which bias the result low because their protons are broadened beyond integration. The solution is allowed to reach the probe temperature, then locked and shimmed until lineshape is symmetric, because a poor lineshape spreads area into the wings and frustrates integration. For the external and electronic routes the sample volume in the active region must match that of the calibration, so a fixed fill height and the same make of tube are used.
3.2. Step 3: Acquire a quantitative spectrum
The pulse is calibrated on the sample itself. The relaxation delay is set from the longest proton spin-lattice relaxation time, which for small molecules in solution is a few seconds but can be longer for isolated protons, so a short preliminary inversion-recovery experiment is worthwhile when the longest value is unknown. Inverse-gated proton decoupling is used where carbon-coupled satellites or exchange complicate the spectrum. Enough scans are taken for adequate signal-to-noise on the least intense multiplet to be integrated, and the receiver gain is kept within its linear range and recorded, since the external calculation depends on it.
3.3. Step 4: Phase, baseline and integrate
Processing is where avoidable error enters. The spectrum is phased carefully, and the baseline is corrected with a low-order function so that integration does not accumulate a sloping offset over a wide region. Integration limits are set wide enough to capture the multiplet and its carbon-thirteen satellites, or the satellites are integrated and added explicitly, since omitting them understates a strong signal by about one percent. Multiplets chosen for quantification should be well resolved from solvent, water and impurity peaks; where overlap is unavoidable, deconvolution or line fitting is preferable to a crude integral.
3.4. Step 5: Compute the mass fraction
The amount of analyte follows from its area per proton relative to the reference area per proton and the known amount of reference, whether that reference is a real compound of weighed mass, a capillary standard of known concentration and volume, or an electronic signal of calibrated area. The mass fraction is then the measured analyte mass divided by the weighed sample mass, using the analyte's molar mass. The purity so obtained is the content of the named compound; it is not the sum of all impurities, and the two agree only when every non-analyte component is accounted for. Reporting the result as a mass balance, with the identified impurities and any residual solvent and water subtracted explicitly, makes the basis of the number clear.
3.5. Step 6: State the uncertainty and the limits
The reported purity should carry an uncertainty that combines the contributions from weighing, integration, the reference value and, for the external routes, the matching of acquisition conditions, in the manner recommended for measurement uncertainty generally (JCGM, 2008). The external and electronic routes carry one component that the internal standard does not, namely any difference in the effective sensitivity between the reference measurement and the sample measurement, arising from tuning, temperature, pulse calibration or sample volume. The procedure controls that component by matching conditions and by periodic recalibration, but it cannot remove it, and honesty about it is part of the method.
4. Fitting the Procedure to a Synthesis Laboratory
The attraction of an external reference in a synthesis laboratory is that the sample is recovered unchanged and uncontaminated, which matters when the material is scarce or is to be carried forward. The electronic route further removes the need to keep and weigh a standard, which suits routine checks on many samples. These gains are bought with a stronger dependence on instrument stability and on careful matching of conditions, so the laboratory that adopts the method should calibrate on a schedule, keep tube and volume constant, and verify the calibration against a weighed internal standard from time to time on a representative sample. Used this way the method gives an absolute purity with a clear audit trail rather than an area percent.
5. Limitations and What Remains to Be Shown
This article proposes a procedure and does not test it. Several things would need to be established before it could be recommended without reservation. One is agreement: whether, on representative intermediates, the external, coaxial and electronic routes return the same mass fraction as a well-executed internal-standard determination, within the stated uncertainty. A second is robustness: how much the result drifts with the time between calibration and measurement, with small changes in sample volume, and with routine retuning and temperature variation. A third is reach: how the method performs on intermediates with few protons, with very long relaxation times, or with signals that overlap the usual reference regions. Each can be examined with samples a laboratory already holds, and each is a natural subject for a validation study.
Two cautions apply whatever the route. Quantitative NMR measures the protons it can integrate, so an impurity that is invisible by NMR, an inorganic salt or a proton-free species, is not counted and must be determined separately before a mass balance can close. And the number of protons assumed per molecule must be correct; an error in the assigned structure propagates directly into the purity.
6. Conclusion
Purity can in principle be assigned to a synthetic intermediate by proton qNMR without mixing a standard into the sample, by referencing an external measurement, a sealed capillary or a calibrated electronic signal. The six-step procedure set out here keeps the acquisition quantitative, makes the reference and its assumptions explicit, and reports the result as a mass balance with an uncertainty that includes the extra component the external routes introduce. Whether the routes agree with the internal standard closely enough to replace it for a given class of intermediate is an empirical question that this article leaves open and that practitioners are well placed to answer.
Conflict of interest
To be declared by the author(s) before publication.
Funding
To be declared by the author(s) before publication.