1. Introduction
The pectoral flipper of the humpback whale carries a row of large, rounded protuberances along its leading edge. Fish and Battle (1995) described the morphology in detail, noted that the flipper cross section resembles a thick symmetric aerofoil, and suggested that the tubercles act as lift-enhancing devices that help the animal sustain the tight turns it uses when feeding. That suggestion turned a zoological curiosity into an aerodynamic hypothesis, and within a decade the first wind tunnel test of an idealised flipper with and without tubercles had been reported (Miklosovic et al., 2004).
The result of that first test was striking: the scalloped model stalled at a considerably higher angle of attack than the smooth one, reached a higher maximum lift, and did so without a drag penalty over most of the range. The paper has shaped expectations ever since. Later experiments on other sections and planforms have not always reproduced the gain, and several have found the opposite sign for maximum lift. Wider reviews of the subject exist (Fish et al., 2011; Aftab et al., 2016; Bolzon et al., 2016), but they range across marine, turbomachinery and aeronautical applications at all scales.
This article has a narrower aim. It reviews the tunnel evidence that bears on wings at low chord Reynolds numbers, taken here loosely as the range from a few tens of thousands to a few hundred thousand, where laminar separation dominates section behaviour and where small unmanned aircraft, model-scale rotors and many laboratory experiments operate. The question it asks is what a designer of such a wing can reasonably expect from tubercles, and how firmly the published measurements support that expectation.
2. Scope and Approach
This is a narrative review of the published literature. It draws on journal papers, conference papers and one widely cited thesis that report force measurements or flow diagnostics on rigid wings and aerofoil sections with sinusoidal or near-sinusoidal leading edges, together with the numerical studies that have been used to interpret them. No attempt was made at an exhaustive or systematic search, and no pooled quantitative synthesis is offered, because the studies differ too much in section, planform, Reynolds number and facility for their coefficients to be averaged meaningfully. Water tunnel and towing tank results are included alongside wind tunnel results where the Reynolds number is comparable, since at these speeds the fluid is effectively incompressible in both.
Two geometric parameters recur throughout. Amplitude is the distance from the mean leading edge line to a peak or trough, and wavelength is the spanwise spacing of successive peaks; both are normally quoted as fractions of the mean chord. The humpback flipper itself has tubercles whose size and spacing diminish towards the tip (Fish and Battle, 1995), whereas most laboratory models use a uniform sinusoid for ease of manufacture and description. That simplification should be kept in mind when results from idealised models are attributed to the animal, or the reverse.
3. The Low Reynolds Number Setting
Low Reynolds number wings behave differently from their full-scale counterparts for a well understood reason. The boundary layer stays laminar far along the chord, cannot withstand much adverse pressure gradient, and separates. The separated shear layer may undergo transition and reattach as a turbulent layer, enclosing a laminar separation bubble, or it may fail to reattach, in which case the section stalls abruptly and often with hysteresis (Tani, 1964; Lissaman, 1983). Section performance in this regime is sensitive to freestream turbulence, surface roughness, acoustic disturbances and model vibration, which is why data for the same aerofoil from different tunnels can disagree (Mueller and DeLaurier, 2003).
That sensitivity matters for the tubercle literature in two ways. First, a leading edge modification that introduces streamwise vorticity alters the transition process itself, so part of any measured benefit may come from energising a boundary layer that would otherwise be laminar, an effect that conventional trips or small vortex generators can also deliver (Lin, 2002). Secondly, the baseline wing against which tubercles are judged is itself a moving target at these Reynolds numbers. A comparison is only as good as the smooth-wing data it rests on.
4. Evidence From Force Measurements
The experimental record divides naturally by model type. Table 1 summarises representative studies and the direction of their main findings; the paragraphs that follow discuss them in turn.
| Study | Model and facility | Main reported outcome |
|---|---|---|
| Miklosovic et al. (2004) | Idealised flipper planform, thick symmetric section, wind tunnel | Later stall, higher maximum lift, lower post-stall drag |
| Johari et al. (2007) | Full-span thick section, several amplitudes and wavelengths, water tunnel | Lower maximum lift, higher post-stall lift; amplitude matters most |
| Miklosovic et al. (2007) | Full-span and semi-span models compared, wind tunnel | Benefit on the finite model, penalty before stall on the full-span one |
| Stanway (2008) | Flipper-like foil over a range of Reynolds numbers, water tunnel | Outcome depends on Reynolds number; stall softened |
| Hansen et al. (2011) | Two symmetric sections with different thickness positions, wind tunnel | Small amplitude and wavelength best; section shape changes the result |
| Guerreiro and Sousa (2012) | Low aspect ratio rectangular wings, wind tunnel | Useful lift gains at high incidence at the lower Reynolds number |
| Custodio et al. (2015) | Rectangular, swept and flipper planforms, water tunnel | Planform dependent; flipper shape gains most |
4.1. Full-span sections
When a section spans the tunnel from wall to wall, the test isolates what tubercles do to a nominally two-dimensional flow. Johari et al. (2007) tested a thick symmetric section with a family of sinusoidal leading edges and found that the modified sections did not stall in the conventional sense. Lift rose more slowly, peaked at a lower value than on the smooth section, and then held up well instead of collapsing, so that at angles beyond the baseline stall the scalloped sections carried substantially more lift. Drag was higher in the pre-stall range. Amplitude had a strong influence and wavelength a weak one. Hansen et al. (2011) reached compatible conclusions on two sections of equal thickness but different chordwise position of maximum thickness, and added two points: the smallest amplitudes and wavelengths gave the least pre-stall penalty, and the section with its maximum thickness further aft, which has a longer run of laminar flow, benefited more.
A study aimed specifically at low Reynolds number control reported that protuberances on the section changed the stall from an abrupt leading edge type to a progressive one and reduced hysteresis (Zhang et al., 2013). The pattern across these section tests is therefore consistent. In two dimensions, tubercles trade peak lift for a benign stall, and the trade is most favourable where the baseline is troubled by laminar separation.
4.2. Finite wings
Finite wings give a more encouraging picture, and the reason was made clear by Miklosovic et al. (2007), who tested full-span and semi-span versions of the same tubercled geometry. The full-span model lost lift and gained drag before stall, as in the section tests. The semi-span flipper model retained the higher stall angle and maximum lift seen in the earlier work. The benefit thus appears to be tied to three-dimensional effects: on a tapered wing the tubercles interrupt the spanwise progression of stall and compartmentalise the separated regions.
Custodio et al. (2015) examined this directly with rectangular, swept and flipper-shaped planforms. The rectangular wings behaved much like the two-dimensional sections, while the flipper planform showed lift improvements over a band of incidence. At low aspect ratio, Guerreiro and Sousa (2012) found that sinusoidal leading edges raised lift at high angles of attack and that the improvement was more marked at the lower of their two test Reynolds numbers, a result of direct interest for micro air vehicles. Experiments on tubercled hydrofoils at low Reynolds number have likewise linked the gain to suppression of large-scale separation behind the peaks (Wei et al., 2015). Stanway (2008) had earlier shown that the same flipper-like foil could look better or worse than its smooth counterpart depending on Reynolds number, which cautions against quoting any single percentage as the effect of tubercles.
5. Flow Physics Behind the Measurements
Several explanations have been advanced for these force trends, and they are not mutually exclusive. The earliest likened tubercles to vortex generators that re-energise the boundary layer (Fish and Lauder, 2006). van Nierop et al. (2008) objected that the wavelength and amplitude of tubercles are far larger than the boundary layer thickness and proposed an aerodynamic model in which the spanwise variation in chord and in downwash makes the sections behind peaks and troughs stall at different angles, flattening the lift curve without invoking mixing.
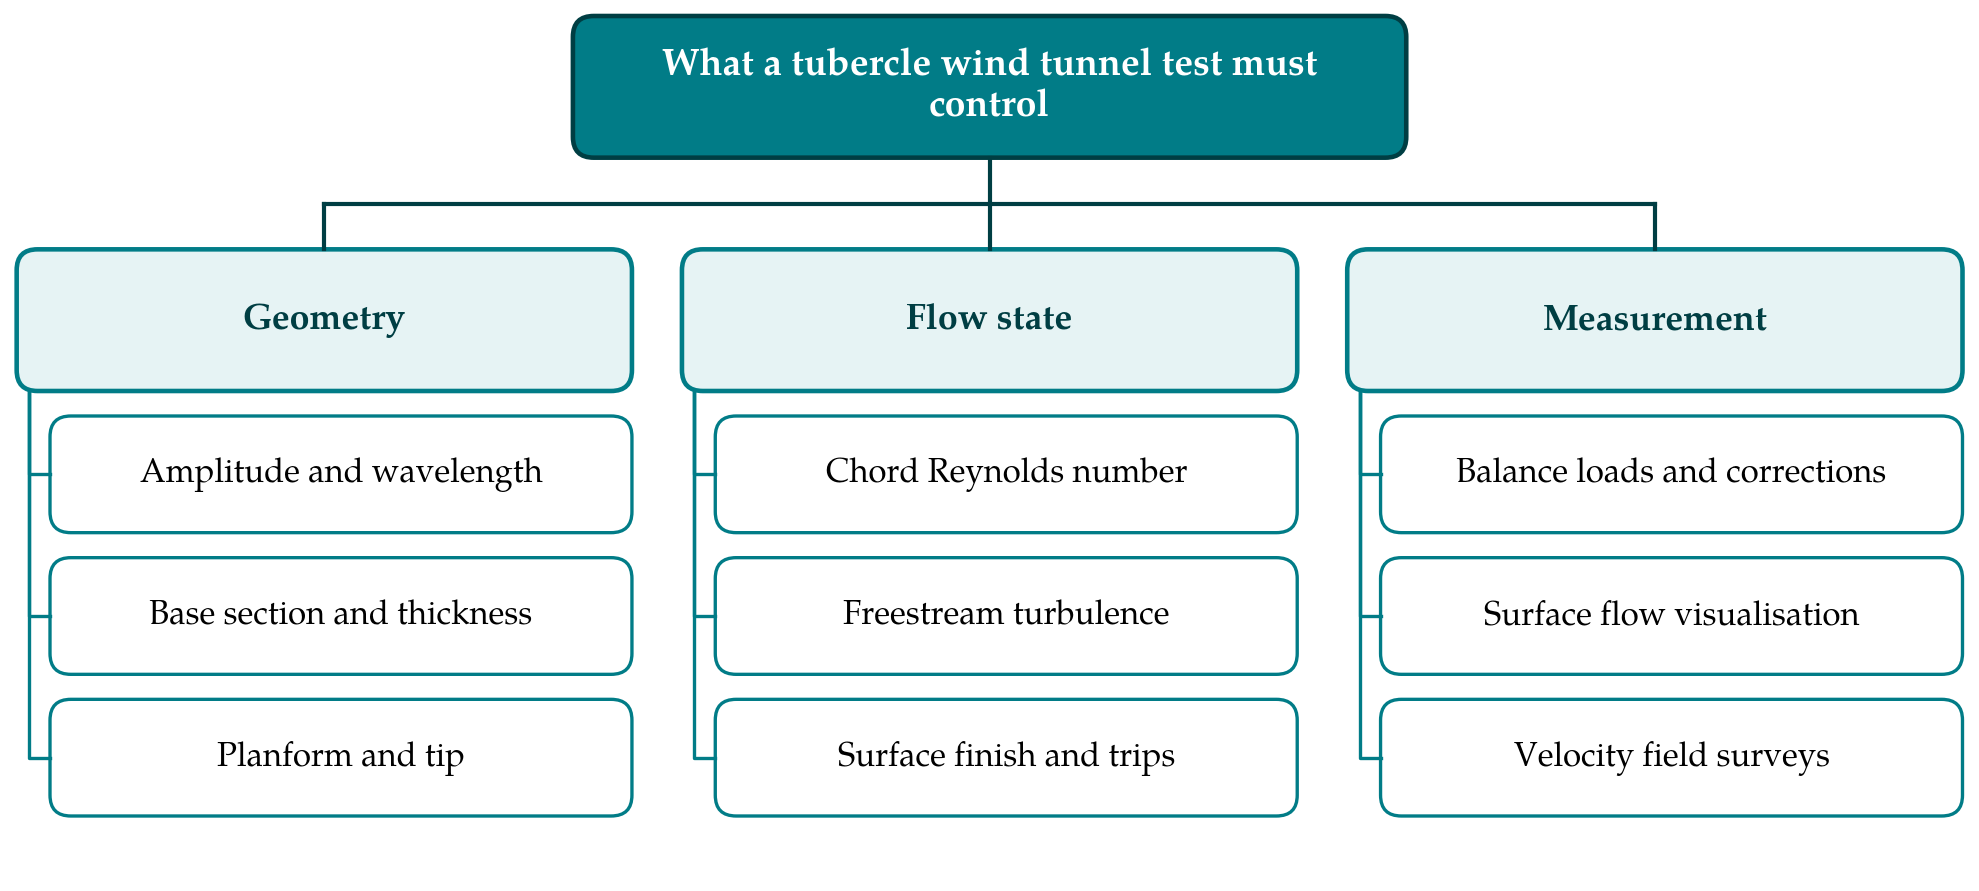
Detailed measurements and simulations have filled in the picture. Each tubercle sheds a pair of counter-rotating streamwise vortices. Flow behind the troughs separates early, while flow behind the peaks stays attached to a higher incidence, giving the characteristic pattern of separation cells seen in surface flow visualisation. Detached-eddy simulation of the original flipper reproduced the delayed tip stall and attributed it to these vortices confining separation to the outboard region (Pedro and Kobayashi, 2008), and a later computational evaluation showed how sensitive such predictions are to the turbulence model at tunnel Reynolds numbers (Weber et al., 2011). Large-eddy simulation of a full-span section identified a secondary flow, driven by the spanwise pressure gradient, that carries low-momentum fluid from behind the peaks towards the troughs and so keeps the peak flow attached (Skillen et al., 2015). Rostamzadeh et al. (2014) traced the origin of the streamwise vorticity to the skewing of the boundary layer by the wavy leading edge, and Hansen et al. (2016) followed the vortices downstream with velocity field measurements and showed that their circulation grows with incidence. Figure 1 groups the variables that these studies show a test must control or report.
For the low Reynolds number designer the most relevant part of this physics is the interaction with laminar separation. On a smooth section the bubble extends uniformly across the span and its bursting produces the abrupt stall. On a tubercled section the bubble is broken into cells, transition is promoted behind the troughs, and bursting no longer occurs everywhere at once. This accounts for the smoother lift curve and reduced hysteresis, and for the observation that sections with long laminar runs gain most.
The same reasoning explains why the drag penalty before stall is hard to avoid. The streamwise vortices that later confine separation are present at all incidences, and at low angles they add skin friction and a small induced loss while delivering nothing in return, because the smooth wing is not yet in difficulty. Small amplitudes weaken the vortices and so reduce the penalty, which is consistent with the amplitude trends reported in the section tests (Johari et al., 2007; Hansen et al., 2011).
6. Test Technique and Its Influence on Reported Results
A reader comparing papers should keep the conduct of the tests in mind. Forces on small models at low speed are small, and balance resolution, mounting interference and the gap between a wall-to-wall model and the tunnel wall all affect the drag in particular. Standard blockage and streamline curvature corrections assume a conventional wake and become doubtful deep into stall, which is exactly where tubercled wings are claimed to do best (Barlow et al., 1999). Semi-span models mounted on a reflection plane add the influence of the plane's boundary layer on the root.
There is also the matter of reference geometry. A sinusoidal leading edge changes local chord, and studies differ in whether the smooth baseline matches the mean chord, the planform area or the peak chord. Coefficients formed on different reference areas are not directly comparable. Freestream turbulence intensity is not always reported, although it can decide whether the baseline has a short bubble, a long bubble or none. Finally, most rigs measure time-averaged loads, whereas the stall of tubercled wings is known to involve bistable or spanwise-irregular separation patterns. Good practice, drawn from the better documented studies, is to report the baseline against published data for the same section, to state turbulence level and correction method, and to pair balance data with at least one flow diagnostic.
7. Gaps and Directions for Further Work
Four questions stand out as unsettled. The first is scaling. Nearly all the evidence comes from tunnels at Reynolds numbers well below those of the whale and of most aircraft, and the trends with Reynolds number reported so far are not monotonic. Tests of a single geometry across a wide range in one facility would be more informative than further single-point comparisons.
The second is the proper comparator. Few studies have set tubercles against a competent conventional remedy for laminar stall, such as a transition strip, a row of low-profile vortex generators or simply a section designed for the Reynolds number in question. Until that is done, it remains unclear how much of the benefit is specific to the tubercle form.
The third concerns unsteady conditions. Small aircraft fly in gusts, and rotor blades see cyclic incidence. A device that softens static stall may or may not help with dynamic stall, and the evidence on pitching and plunging tubercled wings is still thin. The fourth is optimisation. Amplitude and wavelength have been varied on a few sections, but spanwise-varying or part-span tubercles, and their combination with sweep and taper chosen for an aircraft and not copied from a flipper, have barely been explored experimentally.
A practical matter sits alongside these. A scalloped leading edge is harder to manufacture and to protect against erosion and icing than a straight one, and its structural and aeroacoustic consequences are seldom reported in the aerodynamic papers. Tunnel programmes that record these side effects as well as lift and drag would give designers a fairer basis for a decision.
8. Conclusion
The tunnel evidence supports a qualified claim. Leading edge tubercles reliably change the character of stall on wings at low Reynolds number, making it gradual and preserving lift beyond the angle at which a smooth wing would let go. Whether they also raise maximum lift depends on the planform and the section: finite, tapered and low aspect ratio wings tend to gain, while full-span sections tend to lose a little. Before stall there is usually a small cost in drag. A designer who needs tolerance to high incidence, for example in a perching manoeuvre or a gust encounter, has reason to consider them. One who needs the best cruise efficiency does not, on present evidence. The mechanism is now reasonably well described, and what remains is careful comparative testing across Reynolds number and against conventional alternatives.
Conflict of interest
To be declared by the author(s) before publication.
Funding
To be declared by the author(s) before publication.