1. Introduction
A farmer who hosts a trial strip sees the crop every day, and the researcher who designed it may see it twice. What the researcher takes away is typically a yield per strip. If one treatment emerged unevenly, closed its canopy a fortnight late or lost leaf area to a dry spell, the yield figure records the outcome without the cause. In-season observations would fill the gap, but the usual instruments for measuring canopy development, line quantum sensors and plant canopy analysers, are expensive and need trained operators, and visual vigour scores drift between observers and between visits.
Almost every extension worker and a growing share of farmers now carry a camera of good resolution in a pocket. Digital photographs taken from above the crop have been used for more than two decades to estimate ground cover in soybean (Purcell, 2000) and turfgrass (Richardson et al., 2001), and free applications automate the analysis (Patrignani and Ochsner, 2015). What on-farm trial networks lack is not a tool so much as an agreed way of using one, so that images taken by many hands on many farms yield numbers that can be compared.
This article proposes such a procedure. It is intended for trials in row crops and small grains from emergence to canopy closure, the period in which cover changes fastest and tells most. The procedure is a proposal built from published methods. No application to field data is reported, and the article does not claim that the method has been validated.
2. Background
Three bodies of work inform the design: the agronomic meaning of canopy cover, the colour-based classification of vegetation in images, and the experience of ecologists with cover classes.
2.1. Why canopy cover is worth recording
The fraction of ground covered by green leaf is closely tied to the fraction of sunlight the crop intercepts. Purcell (2000) found that cover measured from digital images tracked intercepted radiation in soybean almost one to one, and the physical basis, the exponential relation between leaf area and transmitted light, is standard biophysics (Campbell and Norman, 1998). Cover also enters water accounting. The FAO method for crop water requirements adjusts crop coefficients for the fraction of ground shaded (Allen et al., 1998), and the AquaCrop model simulates growth through green canopy cover in place of leaf area index (Steduto et al., 2009). A measured cover value is therefore directly usable, apart from its value as a record of vigour.
2.2. Separating green plant from background
An image is turned into a cover value by deciding, pixel by pixel, what is living plant. The classic device is a colour index that exaggerates greenness. The excess green index of Woebbecke et al. (1995), twice the green chromatic coordinate minus the red and the blue, separates plants from soil and residue under a range of light, and Meyer and Neto (2008) showed that subtracting an excess red index gives a quantity that can be thresholded at zero. Where a threshold must be chosen from the image itself, the method of Otsu (1979) picks the value that best separates the two classes of the histogram. The Canopeo tool applies fixed criteria on the ratios of red to green and blue to green together with excess green (Patrignani and Ochsner, 2015). Related indices estimate vegetation fraction from visible bands at larger scale (Gitelson et al., 2002).
Surveys of the field agree on where these methods fail: strong sunlight producing glare on leaves and hard shadows on soil, green weeds and algae, and senescing or stressed foliage that is no longer green (Hamuda et al., 2016; Guijarro et al., 2011). Greenness ratios do follow senescence in a useful way (Adamsen et al., 1999), but a cover method built on green pixels will understate cover in a yellowing crop. These limits shape the capture rules below.
2.3. Scores in place of percentages
Plant ecologists have long recorded cover in classes instead of exact percentages, on the argument that observers can place a quadrat in a class reliably when they cannot agree on a figure (Daubenmire, 1959). The same logic applies to a field method used by many people. An image-derived percentage carries an appearance of precision that capture conditions do not justify, while a score in ten-point bands is honest about its resolution, easy to write on a field sheet and easy for a farmer to check against the crop in front of her.
3. The Proposed Method
The method consists of six steps, shown in sequence in Figure 1. Table 1 lists each step with the error it is designed to control and the item recorded. The description assumes a phone with a rear camera, a light pole or monopod with a phone clamp, and either an application that reports green cover or a desktop program such as ImageJ (Schneider et al., 2012).
| Step | Error controlled | Record kept |
|---|---|---|
| 1. Mark fixed photo points | Different patches photographed on different visits | Plot sketch with point numbers |
| 2. Photograph straight down at set height | Oblique view; frame not matched to row spacing | Pole height and rows per frame |
| 3. Classify green pixels | Subjective judgement of what counts as crop | Rule and settings used |
| 4. Convert cover to a 0-10 score | False precision; transcription slips | Score and cover fraction |
| 5. Check image and overlay | Glare, shadow, weeds, feet in frame | Pass, or reason for retake |
| 6. Record with metadata | Scores that cannot be interpreted later | Date, time, sky, growth stage |
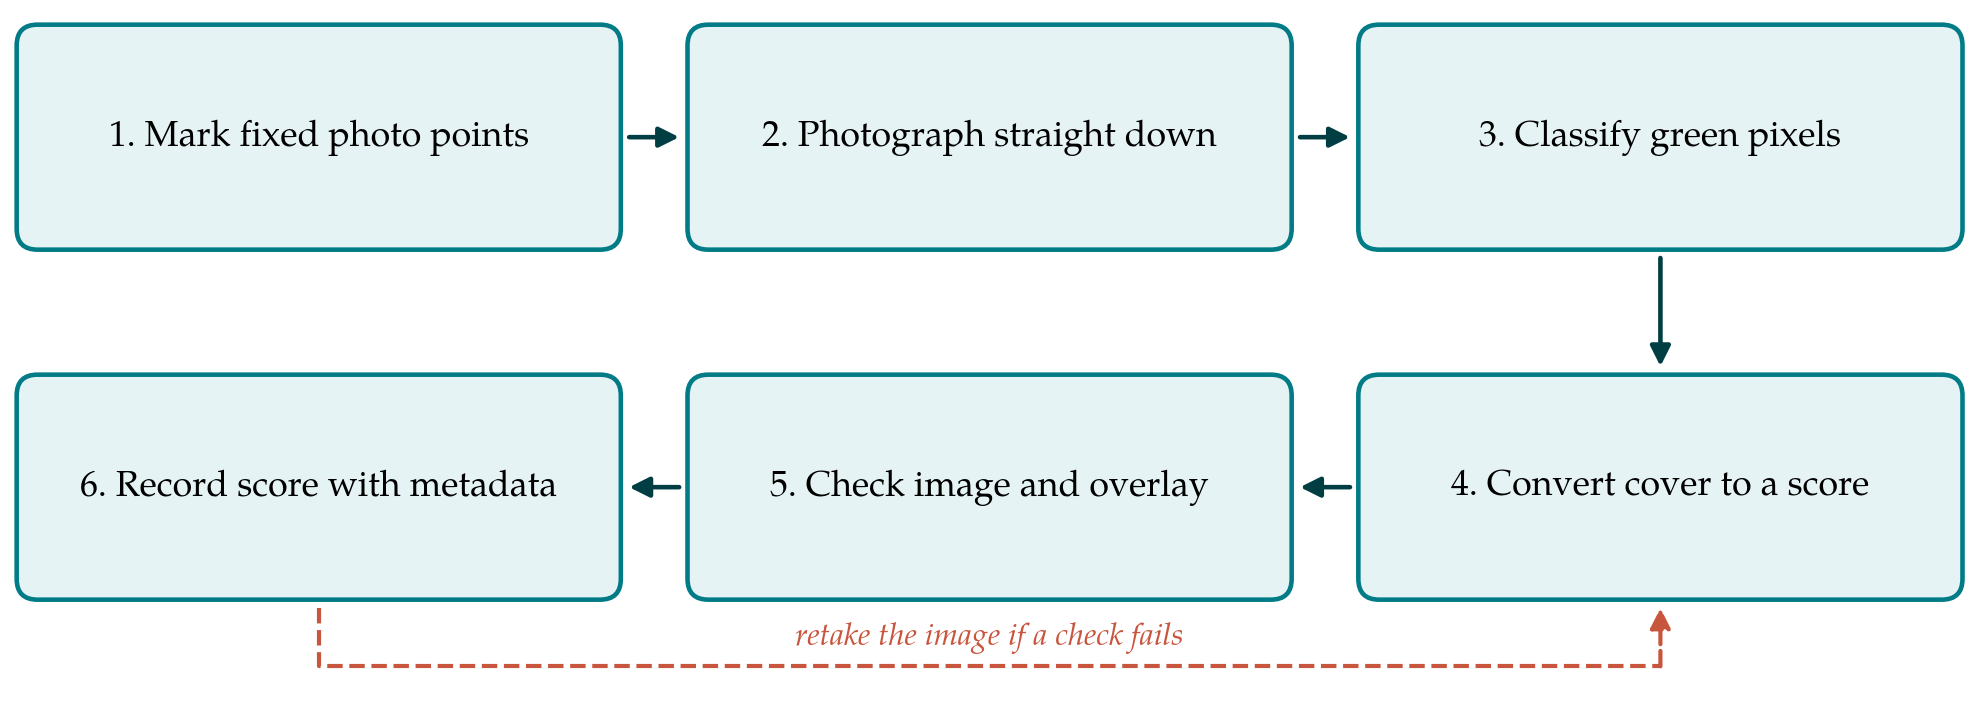
3.1. Step 1: Mark fixed photo points
Each plot or strip receives a set number of photo points, placed away from edges and wheel tracks and marked with a peg so that the same ground is photographed at every visit. Three points per small plot and five or more along a farmer's strip are suggested as starting values; the number needed to reach a given precision depends on how patchy the crop is and should be settled from a pilot season.
3.2. Step 2: Photograph straight down at a set height
The phone is mounted on the pole and held level, lens pointing vertically down, at a fixed height above the canopy. In a row crop the height is chosen so that the short side of the frame spans a whole number of rows, at least two. A frame that covers one row and part of an inter-row will overstate or understate cover according to where it happens to fall. The operator stands so that neither body nor shadow enters the frame. Images are best taken under overcast sky or with the scene uniformly shaded, and the flash, zoom and any beauty or high-dynamic-range filters are switched off.
3.3. Step 3: Classify green pixels
Green pixels are identified by a single rule fixed for the whole trial network. Either of two published options is suitable: the ratio criteria implemented in Canopeo, or excess green minus excess red with a threshold of zero. Small isolated specks are removed with a noise filter of fixed size. The rule and its settings are not to be adjusted plot by plot, because an operator who tunes the threshold until the overlay looks right has reintroduced the subjectivity the method exists to remove.
3.4. Step 4: Convert the cover fraction to a score
The fraction of pixels classed as green is multiplied by ten and rounded to the nearest whole number, giving a score from 0 for bare ground to 10 for a closed canopy. The underlying fraction is kept in the record for later analysis, but the score is what is written on the field sheet and discussed with the farmer. The plot value is the mean of the scores at its photo points.
3.5. Step 5: Check the image and the overlay
Before leaving the point the operator views the classified overlay beside the photograph and answers four questions. Is the image sharp and vertical? Are glare patches or hard shadows being misclassified? Are weeds contributing visibly to the green area? Is anything foreign in the frame? A failure on the first, second or fourth leads to a retake. Weeds cannot be removed by retaking, so their presence is noted and the score flagged.
3.6. Step 6: Record the score with its metadata
A score is interpretable only with its context: date and time, days after sowing, growth stage, sky condition, operator and phone model. The original image is retained under a file name that encodes farm, plot, point and date. Retaining images allows the whole series to be reclassified later should a better rule be adopted, and lets a supervisor audit a sample.
4. Checking Agreement Before Use
Before the scores are used to compare treatments, a trial network should establish how well they agree with a reference on its own crops and phones. Two references are practical. One is manual: a grid of points is laid over a subset of images and each point is called plant or background by eye. The other is physical: fractional light interception measured with a line sensor at the same photo points near solar noon. Agreement, not correlation, is the quantity of interest. The difference between method and reference should be plotted against their mean, with its limits, as Bland and Altman (1986) recommend, and the concordance correlation coefficient of Lin (1989) summarises departure from the one-to-one line in a single figure. The comparison should be repeated across growth stages, since bias is likely to differ between a seedling crop on bright soil and a nearly closed canopy.
Repeatability deserves the same attention. Two operators photographing the same points on the same day, and one operator using two phones, give a direct estimate of the variation that the protocol leaves uncontrolled. If that variation is larger than the treatment differences of interest, more photo points or tighter capture rules are needed.
5. Fitting the Method to On-Farm Trials
The procedure was designed around three realities of on-farm work. Time is short, so the routine at each point is limited to one image and one check. Operators change, so every decision that could be left to judgement is fixed in advance or recorded. Connectivity is unreliable, so nothing depends on a network connection in the field; images and scores can be uploaded later. A visit at three or four stages between emergence and canopy closure is enough to describe the course of cover in most annual crops, and the sequence of scores for each strip can be set beside its yield when results are discussed with the host farmers.
6. Limitations and What Remains to Be Shown
The method is proposed and has not been tested here. Its accuracy, its repeatability between operators and devices, and the number of photo points needed per plot are all empirical matters that only field use will settle. Phone cameras apply their own colour processing, which differs between manufacturers and changes with software updates, and the effect of this on fixed colour rules is not known in advance. Wide-angle lenses view the edges of the frame obliquely, which inflates apparent cover in tall crops, so the method is best confined to the period before the canopy approaches the camera. The retrieval of leaf area index from downward-looking photographs, which could extend the record beyond that point, is treated by Liu and Pattey (2010).
Two limits are inherent. Cover saturates: once the canopy closes the score stays at ten while leaf area and biomass continue to increase, so the method distinguishes treatments early in the season and not late. And green is not always crop. In weedy plots the score measures total vegetation, and in a senescing crop it measures only what remains green. Neither limit is a reason to avoid the method, but both must be understood by those who read the scores.
7. Conclusion
Canopy cover can be scored from a smartphone photograph quickly enough to be practical on farmers' fields, using colour rules that have been in the literature for years. What makes such scores comparable across farms is discipline in capture and recording, and the six steps proposed here are an attempt to specify that discipline. The proposal now needs testing against reference measurements in real trial networks, and the agreement analysis described above indicates how that test should be made.
Conflict of interest
To be declared by the author(s) before publication.
Funding
To be declared by the author(s) before publication.