1. Introduction
The careers of anglophone writers from Africa, the Caribbean, South Asia and the Pacific have been bound up with the decisions of publishers to an unusual degree. A school textbook house in London launched a paperback series in 1962 that became, for a generation, the main route by which African fiction reached African classrooms, and the editor who ran it for many years has written its history (Currey, 2008). Studies of other firms and of the British market for West African and Caribbean writing have filled in more of the picture (Low, 2011; Davis, 2013). Each of these accounts is built from the archive of one or a few publishers.
Such work is indispensable, and it leaves certain questions hard to answer. It cannot easily show how the whole set of publishers, series, little magazines and prizes fitted together, which of them connected regions that were otherwise separate, or how the pattern shifted between the years of decolonisation and the present. Those are questions about structure across many cases. Quantitative literary history offers methods for them, and scholars working on other fields have shown what bibliographic data can reveal when handled with care (Bode, 2018).
This article sets out a procedure for mapping the publishing networks of postcolonial anglophone writers. It is addressed to literary scholars with little prior experience of data work, and it reports no findings. Its contribution is a sequence of steps, the reasons for them and a frank account of where they may mislead.
2. Background
Moretti (2005) argued that literary history should supplement the reading of individual works with abstract models, graphs, maps and trees, built from large numbers of them. The phrase distant reading has since covered a range of practices, many concerned with the language of texts (Underwood, 2019). The variant relevant here needs no full texts. It works on records about books: who wrote them, who issued them, where and when. Bode has made the strongest case that such records are themselves historical arguments, shaped by the institutions that compiled them, and must be read critically before they are counted.
Two older bodies of thought supply the concepts. Book history, in the formulation of Darnton (1982), follows a text around a circuit from author to publisher, printer, shipper, bookseller and reader. The sociology of literature associated with Bourdieu (1993) describes a field in which publishers and prizes confer recognition, and Casanova (2004) extended that model to an unequal international space with metropolitan capitals. Network analysis gives these ideas a formal expression. Its standard methods are set out by Wasserman and Faust (1994), and their use in historical and literary research is introduced by Ahnert et al. (2020).
Periodicals belong in the model as much as book publishers. Black Orpheus, founded in Ibadan in 1957, Transition, founded in Kampala in 1961, and Bim, published in Barbados from the 1940s, printed many writers before any book of theirs appeared. Their contents pages record ties of editing and first publication that catalogues of books do not hold.
Quantitative literary study has been criticised on the grounds that its results are often either unsurprising or statistically fragile (Da, 2019). Postcolonial digital scholarship has added a second concern: that digital collections reproduce colonial hierarchies of what was thought worth keeping (Risam, 2019). The procedure below is designed with both criticisms in mind.
3. The Procedure
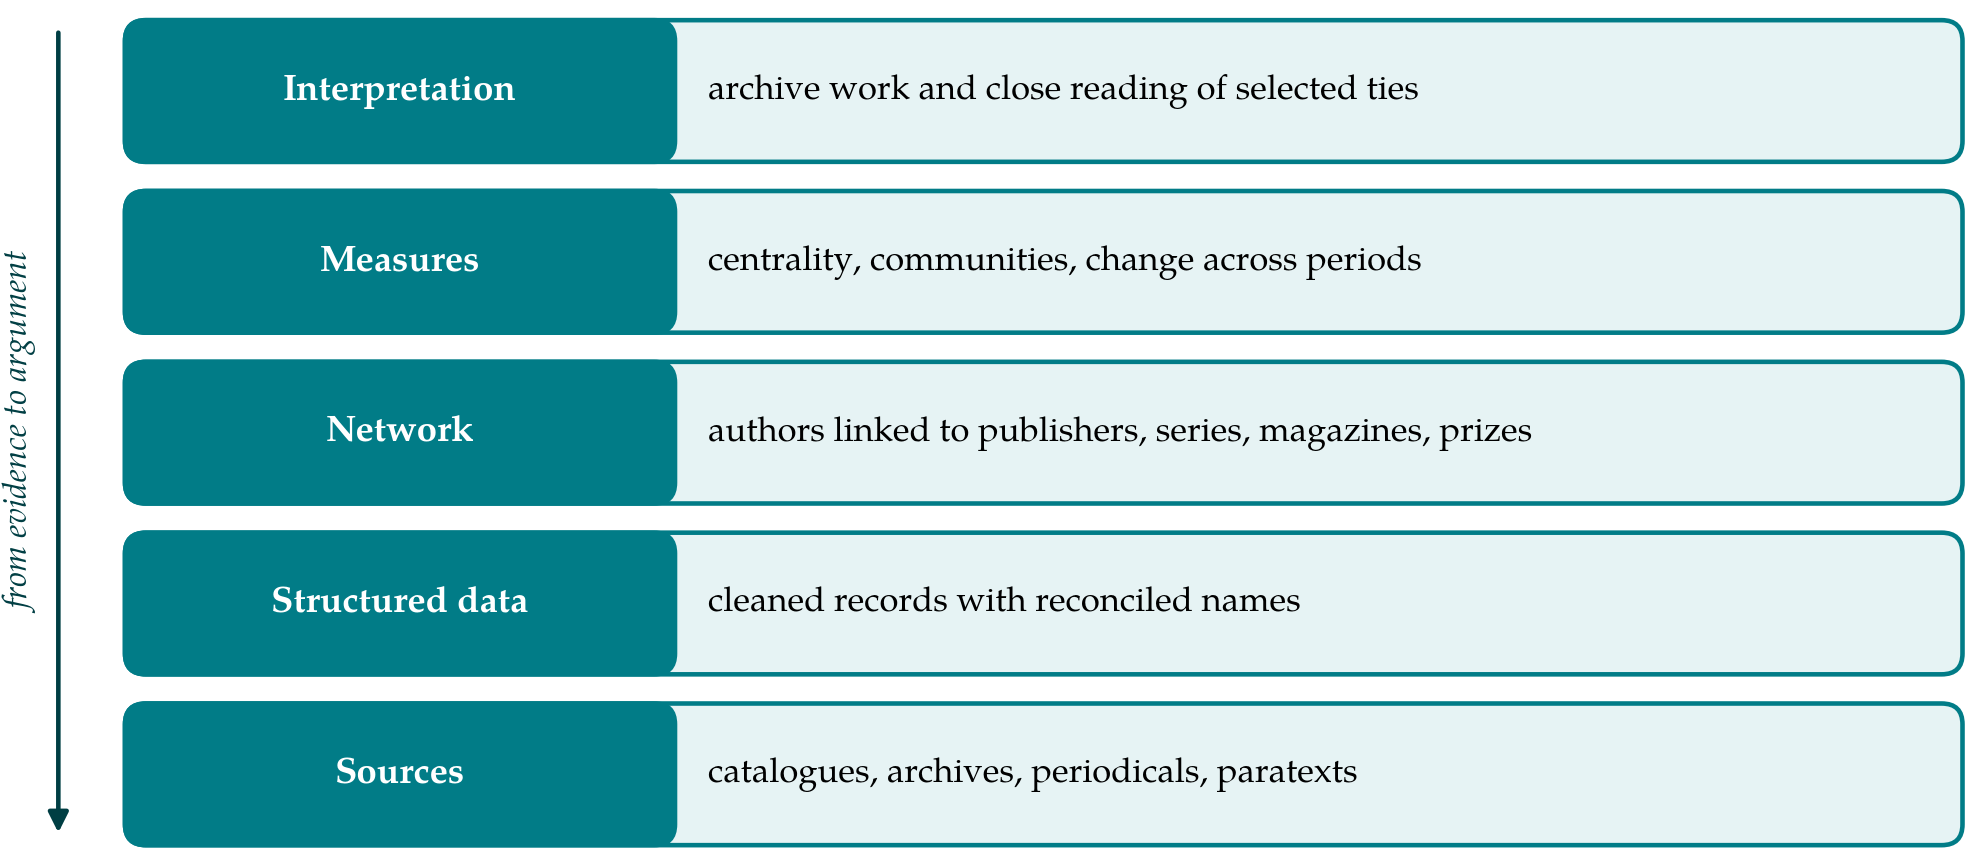
The work moves upward through five levels, from sources to interpretation, as Figure 1 shows. The eight steps that follow are grouped under those levels.
3.1. Step 1: Fix the question and the boundaries
A network study needs a question that a network can answer, such as which publishing entities linked writers of different regions in a given period. The researcher must then state who counts as an author in the corpus. Any rule, whether by birthplace, citizenship or first place of publication, will be contestable for writers who migrated, and the rule adopted should be written down together with the hard cases it produced. Dates and the forms of writing included are fixed at the same point.
3.2. Step 2: Gather sources
No single source records the field. Table 1 lists the main kinds, what each contributes and the direction in which each is skewed. At least two kinds should be combined so that the weaknesses of one can be checked against another.
| Source | What it yields | Known bias |
|---|---|---|
| Union catalogues and national bibliographies | Author, title, publisher, place and date of each edition | Strong for British and North American imprints, weaker for local presses |
| Publishers' archives and series lists | Editors, readers, contracts, series membership | Survive mainly for large metropolitan firms |
| Contents of literary magazines | First appearances and editorial circles | Indexing is uneven; short-lived titles are often missing |
| Prize longlists, shortlists and juries | Ties of recognition between authors, judges and sponsors | Record the consecrated few, not the field |
| Paratexts of the books | Acknowledgements, dedications, introductions, blurbs | Require manual transcription; conventions vary by period |
| Open knowledge bases and authority files | Identifiers, dates, places, name variants | Coverage follows existing fame and language |
3.3. Step 3: Design the data model
Before any record is entered, the researcher decides what the entities and relations are. A workable model has persons, organisations (publishers, magazines, prize bodies), series and works, connected by dated events: a work is published by an organisation in a place in a year; a person edits a series; a person judges a prize. Storing events and not simply pairs keeps the evidence for every link and lets the same data be cut by period or by place later. Each event carries a note of its source.
3.4. Step 4: Clean and reconcile names
This is the slowest step and the one on which the rest depends. Authors appear under changed, married, transliterated and abbreviated names, and publishers under the names of parent firms, local subsidiaries and imprints. An author who is split into two nodes, or a publisher whose Nairobi and London offices are merged into one, will distort every later measure. Names should be matched to authority identifiers where these exist and resolved by hand where they do not, with a log of every decision. Whether a subsidiary is treated as part of its parent is a matter for the research question, and the data should allow either reading. Tools built for cleaning tabular data, which cluster similar strings and propose matches against external identifiers, speed the work but do not remove the need for a person who knows the field to approve each merge.
3.5. Step 5: Build two-mode networks
The natural form of the data is a two-mode network, in which authors are connected to publishing entities and not directly to one another. It should be analysed in that form where possible. Projecting it to an author-to-author network, in which two writers are tied because they shared a publisher, inflates the density around large firms and can suggest communities that are artefacts of the method (Borgatti and Everett, 1997).
3.6. Step 6: Divide into periods
A single graph of several decades hides change. The data are divided into periods chosen for historical reasons, for instance before and after the independence of the territories concerned, and a network is built for each. Period boundaries should be varied by a few years to see whether the picture depends on them. Comparing periods also guards against a common error, that of reading a cumulative graph as though all its ties existed at once. A series active in the 1960s and a prize founded in the 1980s may appear as neighbours in such a graph although they never operated together.
3.7. Step 7: Compute a small set of measures
Three measures are usually enough. Degree counts how many authors a publisher issued, or how many publishers an author used. Betweenness indicates which nodes lie on the paths between otherwise separate parts of the network, the formal counterpart of a broker (Freeman, 1978). Community detection, for which the method of Blondel et al. (2008) is widely used, groups nodes that are more closely tied to each other than to the rest. Free software such as Gephi handles networks of this size and draws them (Bastian et al., 2009). Every figure should be reported with a statement of how it changes under the alternative choices made at steps 4 to 6.
3.8. Step 8: Return to archives and texts
A measure is a prompt for interpretation and not a finding. A magazine with high betweenness, or an author who sits between two clusters, is a case to be taken back to correspondence, memoirs and the books themselves. The researcher should also look for what the graph cannot show: manuscripts refused, presses that left no catalogue trace, and readers. Where the archival record contradicts the graph, the graph is corrected and the correction is logged, so that interpretation feeds back into the data.
4. Fitting the Procedure to Postcolonial Material
Three adjustments are specific to this field. The first concerns place. Catalogue records give a city of publication, but a book issued in London for the school market in East Africa belongs to both. Where the sources allow, place of intended sale should be recorded next to place of imprint. The second concerns local publishing. Presses and magazines in Ibadan, Kampala, Bridgetown, Georgetown and Suva are thinly represented in metropolitan catalogues, and a network drawn from those catalogues alone will show London at the centre partly because London compiled the records. Regional bibliographies and the tables of contents of local magazines are the corrective, and time should be set aside for entering them by hand.
A caution about pictures also applies. Network diagrams are persuasive, and the common layout methods place well-connected nodes in the middle of the image whatever their location on the globe. A reader who sees a metropolitan firm at the centre of the drawing may take a convention of the software for a fact about literary history. Diagrams should therefore be printed with the table of measures from which they derive, and maps that use real geography should be kept distinct from layouts that do not.
The third adjustment concerns the people represented. The data describe published authors, some of them living, and their professional ties. Only public information should be used, and the dataset and its documentation should be deposited so that others can check and extend it, in line with the principles that data be findable, accessible, interoperable and reusable (Wilkinson et al., 2016).
5. Limitations and What Remains to Be Shown
The procedure is proposed here and has not been carried out. Several things would need to be established before its results could bear weight. One is whether the networks it produces are stable under reasonable changes to the corpus rule, the handling of subsidiaries and the period boundaries. A second is whether adding local sources alters the structure or only its margins. A third is whether the measures point to brokers and groupings that archive-based scholars recognise, and whether they ever point to ones that scholars had missed. If the answer to the last is always no, the method confirms what was known at considerable cost.
Some limits cannot be removed. A publishing tie records that a book appeared, not why, and says nothing of advances, print runs or sales unless those are added from archives. Oral, manuscript and non-English literary activity falls outside the model. The method is best regarded as one instrument among several, most useful when it is in the hands of people who also read the archive and the books.
6. Conclusion
The relations between postcolonial anglophone writers and the institutions that published them can be modelled as a network built from bibliographic events, and doing so offers a view of the whole that studies of single firms cannot give. The eight steps described here place most of the effort where the risks are greatest: in defining the corpus, combining sources with different biases, reconciling names and testing how far results depend on those choices. The value of the approach is still to be shown in practice, and the first trials should be judged by whether they tell historians of the field something they did not already know.
Conflict of interest
To be declared by the author(s) before publication.
Funding
To be declared by the author(s) before publication.