1. Introduction
Measuring what older people eat matters for clinical care and for research on ageing, and it is difficult. Twenty-four hour recalls and food frequency questionnaires depend on memory, which is the faculty most likely to be failing. Written food records demand sustained attention, legible handwriting and the ability to describe portions. Experience from studies of elderly people in the Netherlands shows that each conventional method needs adapting for this group and that none is free of difficulty (de Vries et al., 2009).
Photographs offer a different route. A person who takes a picture of a plate before and after eating has made a record that does not rely on recall, and a trained analyst can identify the foods and estimate the amounts later. Reviews of image-based methods conclude that photographs can improve the accuracy of self-report and are generally well accepted (Gemming et al., 2015; Boushey et al., 2017). Most of the validation work, however, has been done with younger and middle-aged adults.
A method validated in one population cannot be assumed valid in another. Older adults may eat smaller portions, more mixed dishes prepared at home, and meals taken over a long time; they may also handle a phone less easily. This article proposes a protocol for testing whether a smartphone photo diary agrees with weighed food records in people aged about 65 and over. It describes a procedure and the reasoning behind it. No data are reported.
2. Background
The design of a validation study follows from three matters: what the test method is, what it is to be compared with, and what agreement means.
2.1. Image-based dietary records
Boushey et al. (2017) distinguish image-assisted methods, in which photographs support a conventional record or recall, from image-based methods, in which the photographs are the primary record. The Remote Food Photography Method is the best documented of the latter. Users send images of food selection and leftovers to a server, and analysts estimate intake by comparison with reference images of known portions (Martin et al., 2009). It has been compared with weighed intake and with doubly labelled water in adults and found to underestimate energy intake by a modest margin (Martin et al., 2012). The approach grew out of digital photography of cafeteria trays, which was shown to agree closely with weighing (Williamson et al., 2003).
2.2. The weighed record as reference
A weighed food record, in which every item is weighed before eating and leftovers are weighed afterwards, has traditionally been treated as the most precise practical measure of intake over the recorded days, and other methods have been judged against it (Bingham et al., 1994). It is not a true gold standard. The act of weighing changes what people eat, and comparisons with doubly labelled water show that self-reported energy intake, however recorded, tends to fall below expenditure (Schoeller, 1995). Standard texts therefore speak of relative validity when one self-report method is compared with another (Willett, 2013). The protocol below accepts that framing and takes steps to limit its weaknesses.
2.3. What agreement means
A high correlation between two methods shows that they rank people similarly, not that they give the same values. Bland and Altman (1986) proposed plotting the difference between methods against their mean and reporting the mean difference, or bias, with limits of agreement within which most differences fall. Whether those limits are acceptable is a judgement about the use to which the measurement will be put, and has to be made before the data are seen. A review of dietary validation practice recommends applying several statistics together, because each reflects a different facet of validity (Lombard et al., 2015).
3. The Proposed Protocol
The protocol has seven steps, shown in sequence in Figure 1. The first two are preparation, the third and fourth generate the paired data, and the last three concern analysis and reporting.
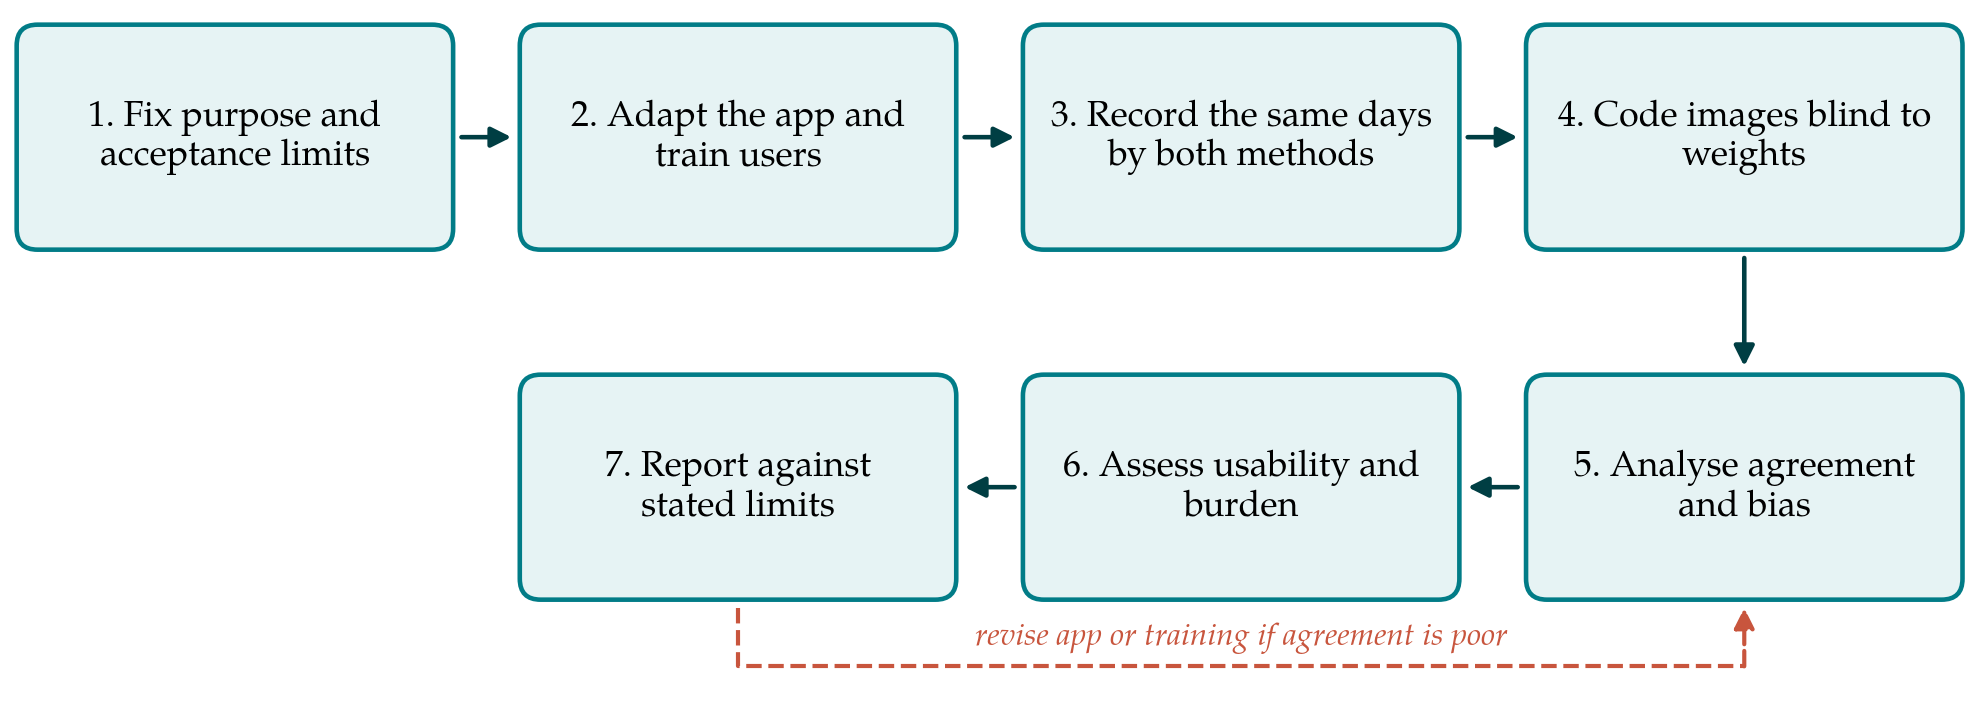
3.1. Step 1: Fix the purpose and the acceptance limits
The investigator first states what the photo diary will be used for: ranking individuals in an epidemiological study, estimating group mean intake, or monitoring a patient's energy and protein intake in practice. Each implies a different standard. The nutrients and food groups of interest are listed, usually energy, protein and a small number of others relevant to ageing. For each, the largest bias and the widest limits of agreement that would still allow the intended use are written into the protocol, with the reasoning, before any recording begins.
3.2. Step 2: Adapt the application and train users
The application should require as few actions as possible: open, photograph, confirm. Large buttons, high contrast and spoken prompts help users with poor sight or unsteady hands. A reference card of known size placed beside the plate gives the analyst a scale. Training is given in person, with practice on real meals, and covers the angle and distance of the photograph, the need for a second image of leftovers, and what to do about second helpings, drinks and snacks taken away from the table. Inclusion criteria should be set with the target population in mind. If people with mild cognitive impairment are to be included, a brief screening instrument such as the Mini-Mental State Examination (Folstein et al., 1975) allows results to be examined by level of cognition.
3.3. Step 3: Record the same days by both methods
Validity is assessed on days when both methods are applied to the same intake. Two arrangements are possible. In the first, the participant both weighs and photographs every item. This is simple but makes the errors of the two methods dependent, since a forgotten snack is missing from both, and it doubles the burden. In the second, a researcher weighs foods and leftovers unobtrusively while the participant only photographs, which is feasible where meals are served, as in day centres, residential care or a research kitchen. The second arrangement gives a more independent reference and is preferred where the setting allows. Recording should cover several days, including a weekend day, and should not be consecutive if fatigue is a concern.
Sample size deserves an explicit justification. Guidance written for the validation of dietary questionnaires holds that studies with fewer than about fifty participants give estimates too imprecise to interpret and that a hundred or more is desirable (Cade et al., 2002; Willett, 2013). The precision of the limits of agreement, expressed as confidence intervals, should be the basis of the calculation.
3.4. Step 4: Code the images blind
Images are coded by trained analysts who have no access to the weighed data. Each food is identified, matched to an entry in the food composition database, and its portion estimated against reference images. The same database and the same recipes for mixed dishes are used for both methods, so that differences reflect the recording method and not the nutrient values. A subset of images is coded independently by a second analyst, and agreement between analysts is reported with an intraclass correlation coefficient chosen and described according to accepted guidance (Koo and Li, 2016). Images that cannot be coded, and the reasons, are counted and reported.
3.5. Step 5: Analyse agreement and bias
Table 1 lists the statistics proposed and what each contributes. The Bland-Altman analysis is central: it shows the average bias, the spread of individual differences, and whether the difference grows with the size of intake. Correlation and cross-classification into thirds or quarters of intake address ranking. A paired comparison of means addresses group-level agreement. Results are judged against the limits fixed in Step 1. Energy intake from both methods can also be compared with estimated requirements using the Goldberg approach to gauge the plausibility of the reference itself (Black, 2000).
| Statistic | Question answered | Caution |
|---|---|---|
| Mean difference with confidence interval | Does the diary read higher or lower on average? | Says nothing about individuals |
| Bland-Altman limits of agreement | How far can one person's two values differ? Bland and Altman, 1986 | Acceptable width must be set in advance |
| Regression of difference on mean | Does bias change with the level of intake? | Sensitive to a few extreme values |
| Correlation coefficient | Do the methods rank people alike? | High values can coexist with large bias |
| Cross-classification and weighted kappa | Are people placed in the same intake category? | Depends on the number of categories |
| Intraclass correlation between coders | Do analysts agree on the same images? Koo and Li, 2016 | Form of coefficient must be stated |
3.6. Step 6: Assess usability and burden
A method that agrees with the reference but that older users abandon after two days is of little use. Completion is therefore measured directly: the proportion of eating occasions with both a before and an after image, and the number of days completed. Perceived usability can be recorded with the System Usability Scale (Brooke, 1996), and short interviews identify the points at which users struggled. Help given by relatives or carers is recorded, since a diary that works only with assistance is a different instrument from one used alone.
3.7. Step 7: Report against the stated limits
The report states the acceptance limits, the results for each nutrient, and a plain conclusion on whether the diary met them. Reporting should follow the STROBE-nut extension for nutritional epidemiology, which lists the details of dietary methods a reader needs (Lachat et al., 2016). Results for subgroups defined in advance, for example by age band, sex or cognitive score, are given with appropriate caution about their precision.
4. Fitting the Protocol to Practice
The protocol can be scaled. A clinical team wanting to know whether a photo diary is adequate for monitoring protein intake in a day centre may restrict the comparison to that nutrient and to served meals, where researcher weighing is straightforward. A research group preparing a cohort study will need free-living participants, the full range of foods, and enough days to describe usual intake. In either case the steps are the same and only their extent changes. Local foods deserve early attention: reference images and recipes for common mixed dishes must exist before coding starts, and building them is often the largest single task.
Privacy needs planning. Photographs taken at home can capture people, documents and surroundings unrelated to the meal. Participants should be shown how to frame only the plate, images should be transmitted and stored securely, and consent should cover who will view them and for how long they are kept.
5. Limitations and What Remains to Be Shown
This protocol is a proposal drawn from published methods and has not been validated in use. Whether older adults can follow it with acceptable completion, how much analyst time it requires per day of record, and whether agreement differs between those with and without cognitive or visual impairment are empirical questions that only an application can answer.
The reference method is the deeper limitation. Agreement with weighed records shows that two self-report methods concur, and both may be biased in the same direction (Subar et al., 2015). Where resources allow, adding an objective marker such as doubly labelled water for energy would strengthen the conclusions. Photographs also cannot reveal what is hidden: fat used in cooking, sugar in drinks and the composition of mixed dishes depend on supplementary questions or on recipes. Finally, a result obtained with one application, one food database and one group of analysts does not transfer automatically to others.
6. Conclusion
A smartphone photo diary may suit older adults better than methods that lean on memory or writing, but that expectation has to be tested in the population concerned. The seven-step protocol proposed here sets the standard of agreement before data are collected, favours an independently weighed reference where one can be had, keeps image coding blind, and treats usability as part of validity. Its value will be known once it has been applied and the results reported in full.
Conflict of interest
To be declared by the author(s) before publication.
Funding
To be declared by the author(s) before publication.