1. Introduction
Vibration measured on a gearbox during run-up, on a bearing with a growing defect or on a structure under a passing load has a spectrum that changes with time. Time-frequency representations were developed to display such change, and there are many of them. Cohen (1989) reviewed the quadratic class that contains the spectrogram and the Wigner-Ville distribution. Reassignment sharpens a representation by moving its values to local centres of gravity (Auger and Flandrin, 1995), synchrosqueezing does so along the frequency axis alone while preserving invertibility (Daubechies et al., 2011), and empirical mode decomposition with the Hilbert spectrum abandons a fixed basis altogether (Huang et al., 1998). The survey of Feng et al. (2013) shows how widely all of these have been applied to machinery.
Abundance has not brought clarity about which representation to use when. Method papers tend to argue by example: a signal, a row of images, a remark that one image is more concentrated. The signals differ from paper to paper, parameters of the competing methods are rarely tuned with the same care as those of the proposed one, and the code is often unavailable. The signal processing community has recognised the general problem for some time (Vandewalle et al., 2009).
This article proposes a protocol for evaluating time-frequency representations of non-stationary vibration signals in a way that others can repeat. It specifies what must be fixed, measured and published. It does not evaluate any method, and it makes no claim about which representation is best.
2. Background
Two considerations shape the protocol: what makes a representation good for vibration analysis, and what makes a computational comparison reproducible.
2.1. What is asked of a representation
A vibration analyst uses a time-frequency image to follow components whose frequency varies, such as shaft orders during a speed change, and to locate short events, such as the impacts of a damaged rolling element (Randall and Antoni, 2011). The first use needs energy concentrated along the instantaneous frequency of each component, a quantity whose definition and estimation are discussed by Boashash (1992). The second needs time localisation, and has its own specialised tools in the spectral kurtosis (Antoni, 2006). The uncertainty principle prevents a linear transform from excelling at both, quadratic distributions gain resolution at the price of cross-terms, and the sharpening methods depend on how well separated the components are (Auger et al., 2013). An evaluation must therefore test several signal types and report several properties.
2.2. What reproducibility requires
Buckheit and Donoho (1995) put the principle in a form that has been quoted ever since: a published computational result is advertising for the scholarship, and the scholarship itself is the complete software and data that generated it. Peng (2011) described a spectrum running from publication alone to full replication, with the release of linked code and data as the attainable middle. The FAIR principles add that data should be findable, accessible, interoperable and reusable through persistent identifiers and clear licences (Wilkinson et al., 2016). Applied to time-frequency evaluation, these ideas mean that signals, parameter choices, random seeds and scores must all be recoverable by a reader.
3. The Proposed Protocol
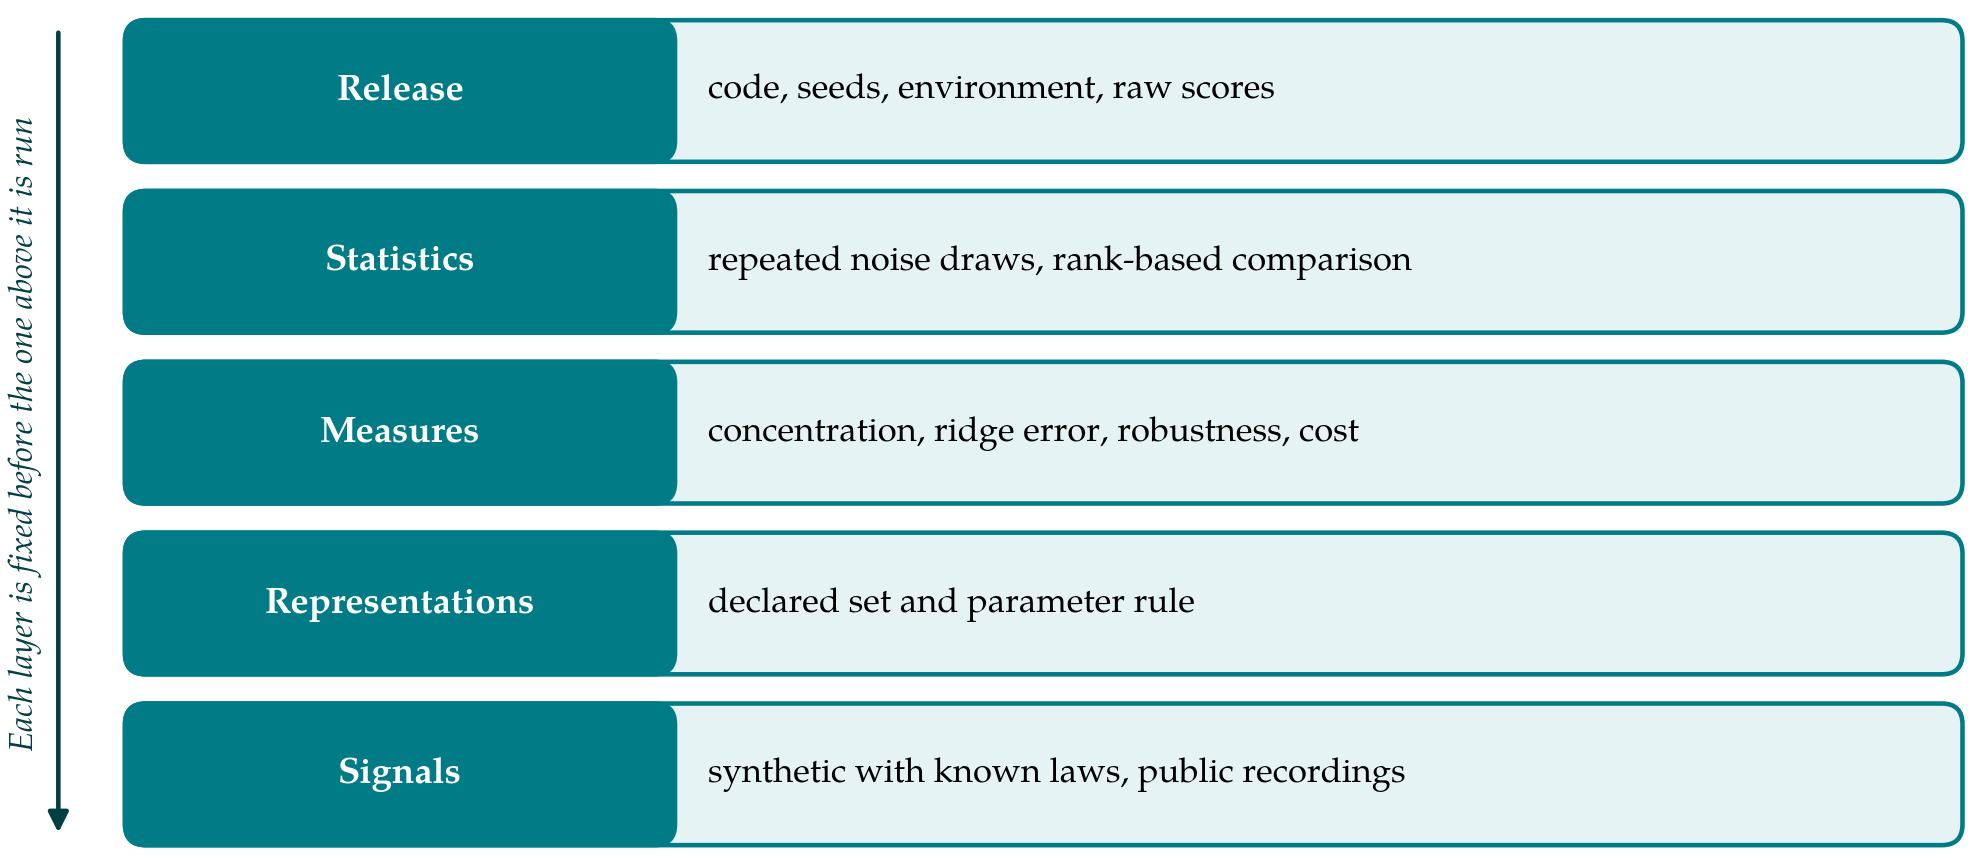
The protocol is organised as five layers, each of which is fixed before the next is run. Figure 1 shows the layers and Table 1 states what each must specify and what it must deliver.
| Layer | Must be specified | Must be delivered |
|---|---|---|
| 1. Signals | Formulas, sampling rate, duration, seeds; identifiers of recorded files | Signal generator script; ground-truth frequency laws |
| 2. Representations | Implementations and versions; fixed or tuned parameter rule | Parameter table for every method and signal |
| 3. Measures | Definitions, normalisation, frequency and time grids | Function that scores any time-frequency array |
| 4. Statistics | Noise model, signal-to-noise definition and levels, repetitions | Per-run scores; rank summary across signals |
| 5. Release | Licence, repository, software environment | Archive that regenerates every figure and table |
3.1. Layer 1: Signals
The signal set has two parts. The synthetic part consists of signals generated from written formulas with known instantaneous-frequency and amplitude laws: a linear chirp, a pair of crossing chirps, components with sinusoidal frequency modulation of several depths, a set of harmonics following a prescribed speed profile as in a run-up, and a train of decaying resonances excited at a known repetition rate to imitate a localised bearing fault. Ground truth is available by construction. The recorded part uses openly available data sets with documented test conditions. For bearings, the benchmark study of Smith and Randall (2015) on the Case Western Reserve University data is a suitable reference because it records which files are and are not diagnosable by established methods. Every signal is identified by a formula and seed or by a persistent file identifier.
3.2. Layer 2: Representations and parameters
The list of representations under comparison is declared in advance, with a named implementation and version for each. The harder requirement concerns parameters. Window length, wavelet centre frequency, smoothing kernels and sifting stop criteria change the result as much as the choice of method does. The protocol asks for a written parameter rule applied identically to every method. Two rules are acceptable. Under a fixed rule, each method uses one setting chosen from its original publication for all signals. Under a tuned rule, each method is tuned by the same search procedure on a tuning subset of signals that is then excluded from scoring. Hand tuning on the scored signals is not permitted, and the search grid is published. Whichever rule is adopted, the proposed method and its competitors are bound by it equally, and the paper states which rule was used.
3.3. Layer 3: Measures
Four measures are proposed. Concentration is scored without reference to ground truth by the Rényi entropy of the normalised representation (Baraniuk et al., 2001) and by the norm-ratio measure of Stanković (2001); lower entropy indicates a more compact image. Because a representation can be compact and wrong, the second measure is ridge accuracy: the instantaneous frequency of each component is extracted with one declared ridge-tracking routine and compared with the known law, and the error is reported as a root-mean-square deviation in hertz or in orders. The third is robustness, the first two measures recomputed as noise is added. The fourth is computational cost, recorded as elapsed time on stated hardware together with the asymptotic complexity. For invertible representations a reconstruction error after mode extraction may be added. All measures are computed on common time and frequency grids, since entropy values depend on the sampling of the plane.
3.4. Layer 4: Statistics
A single noisy realisation proves little. Each synthetic signal is evaluated at several signal-to-noise ratios, defined explicitly as the ratio of signal power to noise power over the whole record, and at each level the noise is redrawn many times with recorded seeds. Scores are reported as medians with interquartile ranges, not as single values. To compare methods across the whole signal set, the rank-based procedure recommended by Demšar (2006) for comparing classifiers over multiple data sets transfers directly: methods are ranked on each signal, average ranks are tested for overall difference, and pairwise differences are examined only if the overall test rejects equality. This guards against declaring a winner on the strength of one favourable signal.
3.5. Layer 5: Release
The final layer is the publication of everything needed to regenerate the results: the signal generator, wrappers for each representation, the scoring functions, the seeds, the raw per-run scores and a description of the software environment with library versions. A single entry script should rebuild every table and figure. The archive is deposited in a repository that issues a persistent identifier and is released under an open licence. A new method can then be added to the comparison by anyone, under the same rules, without rerunning or reinterpreting the earlier ones. Random number generators deserve particular care, because their streams can differ between library versions; storing the generated noise records, or at least checksums of them, removes that source of disagreement.
4. Fitting the Protocol to Practice
The full protocol is more work than a row of spectrograms, and a proportionate version is useful. A minimum form keeps the synthetic signals, the fixed parameter rule, the two concentration measures and ridge accuracy at a few noise levels, and it still requires release. Recorded data and tuned parameters can be added when a paper's claims depend on them. Laboratories that hold proprietary recordings can follow the protocol on the public part and report the private results separately, labelled as not reproducible by readers. Journals and reviewers can use Table 1 as a checklist.
Order tracking deserves a remark, because much rotating-machinery analysis is done after resampling the signal to the shaft angle. A representation computed in the order domain faces an easier problem, since speed-related components become stationary. Where a paper compares methods on run-up or coast-down signals, it should state whether a tachometer reference was used and apply the same pre-processing to every method, so that differences in the results reflect the representations and not the preparation of their inputs.
5. Limitations and What Remains to Be Shown
The protocol is proposed here and has not been exercised on any set of methods, so its practical burden and its power to discriminate among methods are unknown. A first application would show whether the measures agree with one another and with expert judgement of the images, and whether rankings are stable under reasonable changes to the signal set. It would also show how many noise realisations are needed before the medians settle, a number that determines the computing time and that this article does not attempt to fix in advance.
Several limitations can be anticipated. Synthetic signals with clean frequency laws favour methods built on the same signal model, and real vibration contains modulation, noise and transfer-path effects that formulas capture poorly. Ridge accuracy depends on the ridge tracker, and fixing one tracker for all methods is fair without being neutral. Concentration measures reward compactness whether or not the compact energy is correctly placed. Most importantly, a sharper representation is not automatically a better diagnostic. The link from representation quality to fault detection or severity estimation requires labelled data and a task-level evaluation that lies beyond this protocol.
6. Conclusion
Comparisons of time-frequency representations for vibration signals will remain anecdotal until the signals, parameter rules, measures and code behind them are shared. The five-layer protocol proposed in this article sets out one way of doing so, using synthetic signals with known ground truth, public recordings, quantitative measures, repeated trials with rank-based statistics and full release. Its adoption, in whole or in the minimum form, would let results from different groups be placed side by side, which present practice does not allow.
Conflict of interest
To be declared by the author(s) before publication.
Funding
To be declared by the author(s) before publication.