1. Introduction
The coast of Bangladesh is the seaward face of the Ganges-Brahmaputra-Meghna delta, and few shorelines are less fixed. Rivers deliver an immense load of silt, tides of several metres rework it, and cyclones reshape in a night what took years to build. Erosion and accretion proceed side by side, so that some districts lose land while new islands, locally called chars, emerge elsewhere (Brammer, 2014). For a fishing village on such a coast the position of the bank is a matter of homes, landing places and the embankment behind which rice is grown.
Planting mangroves in front of exposed shores has a long history in the country. The Forest Department began coastal afforestation in 1966, chiefly with Sonneratia apetala on newly accreted mudflats, with the aims of protecting life and property from cyclones and of stabilising new land (Saenger and Siddiqi, 1993). Mangroves do attenuate waves: the measurements of Mazda et al. (1997) in planted stands in Vietnam are the classic demonstration, and wider reviews support a protective role within limits (Alongi, 2008). Whether a given plantation changes the course of a shoreline is a separate question and a harder one.
This article does not report a case. It proposes a protocol by which a replanting scheme at one village could be assessed for its effect on shoreline change, using free imagery, simple field equipment and the participation of residents. The protocol has not been applied here; it is offered as a design to be tried, criticised and adapted.
2. Background
Two strands of prior work shape the protocol: experience of why mangrove plantings succeed or fail, and the methods available for measuring shoreline position.
2.1. Why plantings fail
The record of mangrove restoration is uneven. Lewis (2005) argued that most failures stem from planting without first asking why mangroves are absent, and in particular from placing seedlings at elevations flooded too long for them to survive. Primavera and Esteban (2008) documented the same pattern in the Philippines, where planting was repeatedly directed to low seafront flats that were convenient and uncontested but unsuitable. An assessment in Sri Lanka found that a large share of planting projects there had left few or no surviving trees (Kodikara et al., 2017). On eroding mud coasts the difficulty is physical as well: where the sediment balance is negative, seedlings are undermined before they establish, and Winterwerp et al. (2013) set out the conditions of sediment supply and wave energy that must be restored first. Any assessment of shoreline effect must therefore begin by establishing whether a stand exists at all.
2.2. Measuring shoreline position
A shoreline is not a single line, and Boak and Turner (2005) reviewed the many indicators in use, from the instantaneous waterline to the vegetation edge and the high-water mark. On a muddy, low-gradient coast with a large tidal range the waterline can shift hundreds of metres between low and high tide, so that the choice of indicator and the control of tidal stage dominate the error. Water can be separated from land in multispectral imagery with a normalised difference water index (McFeeters, 1996) or its modified form based on a shortwave infrared band (Xu, 2006). Cloud platforms now hold the full Landsat and Sentinel-2 archives and allow them to be processed without local computing power (Gorelick et al., 2017), and open toolkits automate shoreline extraction from those archives (Vos et al., 2019). Rates of change are conventionally computed along shore-normal transects with the Digital Shoreline Analysis System (Thieler et al., 2009).
3. The Proposed Protocol
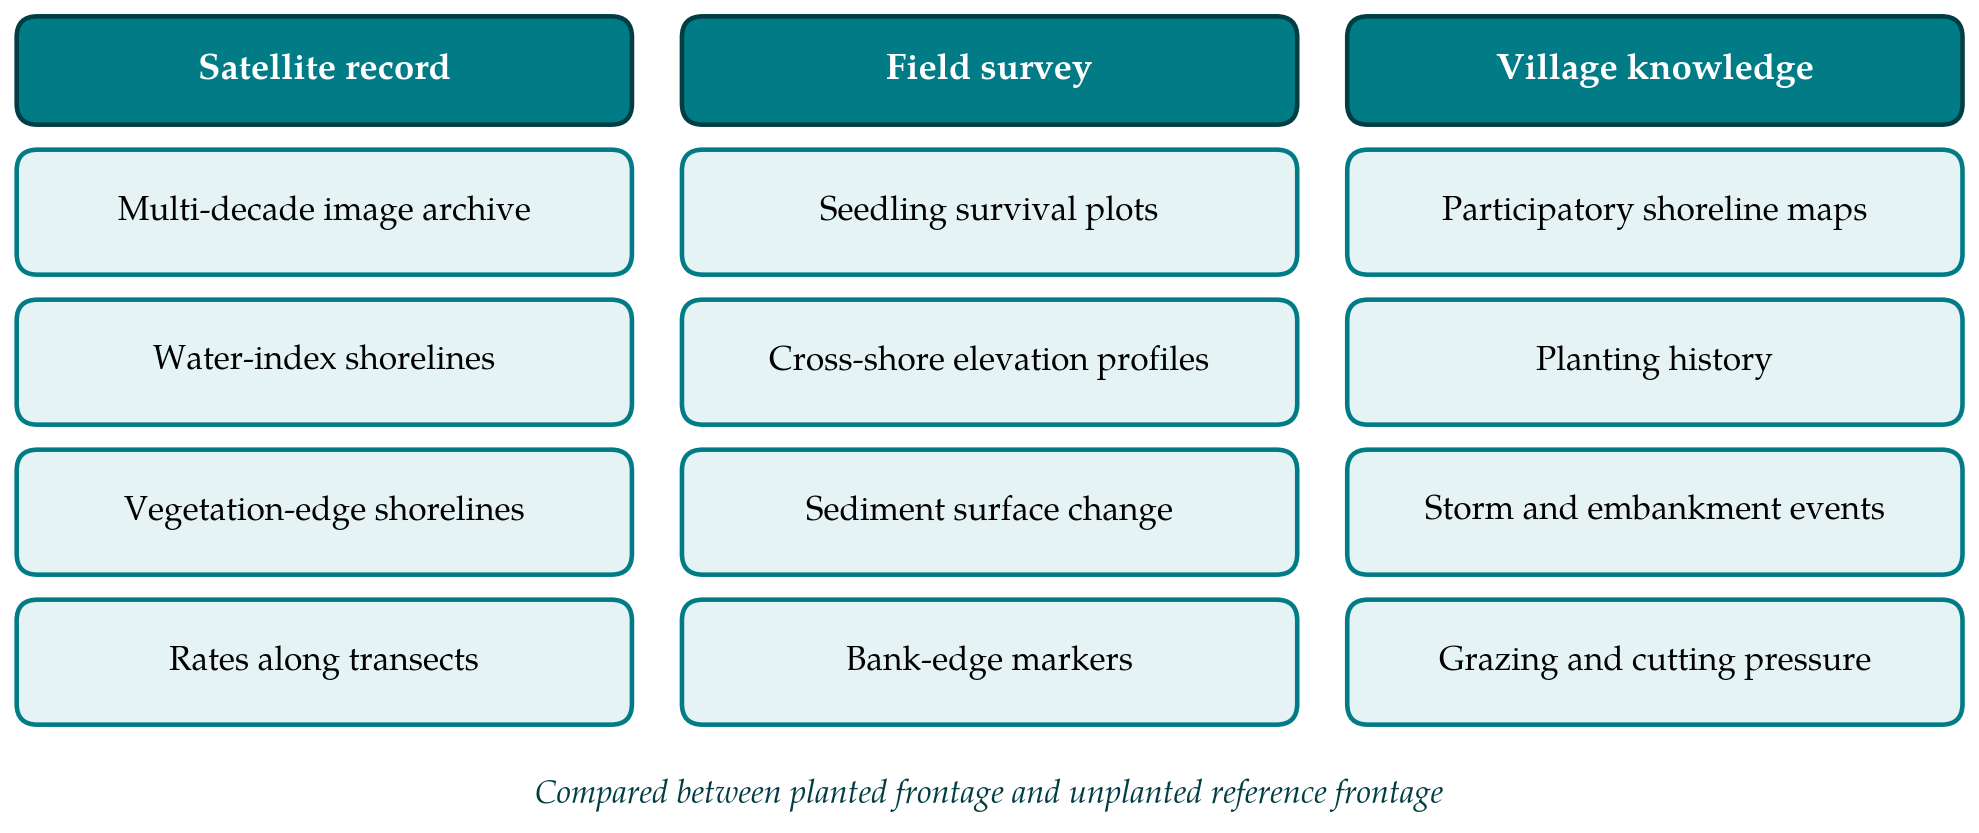
The protocol rests on a comparison. A planted frontage is compared with one or more unplanted reference frontages nearby, and each is compared with itself before and after planting. This is the before-after-control-impact logic developed for environmental impact assessment (Stewart-Oaten et al., 1986), with the refinement urged by Underwood (1992) that several reference sites be used, since any one may differ from the planted site for reasons unconnected with planting. Three kinds of evidence feed the comparison, as set out in Figure 1, and Table 1 lists the steps with their outputs.
| Step | Carried out by | Output |
|---|---|---|
| 1. Define frontages and planting record | Village group with local organisation | Map of planted and reference segments; planting history |
| 2. Extract historical shorelines | Partner institution | Shoreline positions by year, with tidal stage noted |
| 3. Compute rates on transects | Partner institution | Rate of change per transect, before and after planting |
| 4. Survey the stand | Village monitors | Survival, height and density in fixed plots |
| 5. Measure bed and bank | Village monitors with technician | Elevation profiles; bank-edge distances from markers |
| 6. Record village knowledge | Facilitator and residents | Participatory maps; timeline of storms and works |
| 7. Compare and report | All parties | Joint statement of what changed and how sure it is |
3.1. Step 1: Define frontages and the planting record
The village frontage is divided into segments of similar exposure and the planted segments are marked from the records of the planting organisation and the memory of those who planted: when, with which species, at what spacing, and with what replanting since. Reference segments are chosen on the same stretch of coast, facing the same direction, with similar foreshore width before planting and no hard defence built during the study period. If no such segment exists, the protocol can still describe change at the planted site but cannot attribute it, and this should be recorded at the outset.
3.2. Step 2: Extract historical shorelines
For each year of the archive, cloud-free images of the dry season are selected, since the wet season brings cloud and turbid floodwater. Two indicators are extracted. The waterline is obtained by thresholding the modified water index, using only images acquired near the same tidal stage as judged from tide tables for the nearest port. The seaward vegetation edge is obtained from a vegetation index and is far less sensitive to the tide; where a mangrove fringe or grassed bank exists it is the preferred indicator. The pixel size of the imagery sets a floor on what can be detected, thirty metres for Landsat and ten for Sentinel-2, so that only movements of several pixels can be treated as real.
3.3. Step 3: Compute rates of change
Transects are cast at regular spacing perpendicular to a baseline drawn landward of all shorelines. Along each, the net movement between the earliest and latest shoreline and the rate from a linear regression through all dates are calculated, separately for the period before planting and the period since. The quantity of interest is not the rate after planting but the change in rate at planted transects relative to the change at reference transects over the same years.
3.4. Step 4: Survey the stand
Fixed plots are laid out across the planted zone from its landward to its seaward edge and marked with posts. In each, trained village monitors count living and dead stems and measure the height of a fixed number of tagged trees twice a year. Natural recruits are counted separately from planted stems, because colonisation by wild seedlings is a sign that the site suits mangroves. Signs of grazing, cutting and barnacle fouling are noted.
3.5. Step 5: Measure bed elevation and bank position
Whether sediment is building or being stripped is measured directly. Cross-shore profiles are levelled from a fixed benchmark on the embankment along permanent lines through planted and reference segments, after the monsoon and again late in the dry season. Sediment stakes within the plots give a simple local record of surface change; where a partner can install them, rod surface elevation tables provide the precise standard (Cahoon et al., 2002), and their use in mangroves is reviewed by Krauss et al. (2014). Where the shore ends in an erosion scarp, the distance from marker posts to the scarp edge is taped each season.
3.6. Step 6: Record village knowledge
Residents hold a record no satellite has. In facilitated sessions, groups of older fishers, women who collect on the foreshore and embankment labourers each draw the position of the bank at remembered dates, such as a named cyclone or the building of a sluice, on a printed image of the village. They also list events that bear on interpretation: breaches, repairs, dredging, the opening of shrimp ponds. The maps are compared with the satellite shorelines, each serving as a check on the other.
3.7. Step 7: Compare and report
The evidence is brought together in a meeting of all parties. The report states, in plain language and with maps, how the shoreline moved at planted and reference frontages before and after planting, whether a stand has established, whether the bed in front of it is rising or falling, and what other events could explain the pattern. It grades its own conclusion as supported, possible or not shown.
4. Fitting the Protocol to a Village
The division of labour matters as much as the measurements. Image processing needs a computer, a connection and some training, and belongs with a university department or a district office. Plot counts, staking and taping need a tape, a level and a notebook, and belong with the people who walk the foreshore daily. Monitors should be paid for their time and should include women, who in many coastal villages tend the nurseries. Records are kept in Bangla on paper forms and photographed, so that copies exist in more than one place. A commitment of at least five years is needed, since young stands do little to waves and a short series cannot separate a trend from a good or bad monsoon.
5. Limitations and What Remains to Be Shown
The protocol has not been tried, and its central difficulty should not be understated. Planting sites are not chosen at random. Foresters and villagers plant where mud is already accumulating, since that is where seedlings survive, and the afforestation programme was directed from the first at newly accreted land (Saenger and Siddiqi, 1993). A planted frontage may therefore advance for the same reason it was planted, and comparison of rates before and after, against reference segments, reduces this bias without removing it. On a delta coast, moreover, truly comparable reference segments may not exist within a useful distance.
Measurement limits compound the problem. Changes smaller than a few pixels cannot be resolved in the free imagery, tidal stage is known only approximately away from gauged ports, and a single village yields one planted site and hence no statistical replication. What a trial of the protocol would need to show is that village monitors can sustain the field series, that the two shoreline indicators agree well enough to be used together, and that the combined evidence leads different readers to the same conclusion.
6. Conclusion
Mangrove planting in front of Bangladeshi villages is undertaken in the hope of holding the shore, and that hope deserves to be tested site by site. The protocol proposed here sets a planted frontage against its own past and against unplanted neighbours, using satellite shorelines, simple field measurements and the knowledge of residents. It will seldom deliver proof, but it can show whether a stand has taken, whether the bed is building, and whether the shoreline has departed from its earlier course, which is more than most schemes currently know about themselves.
Conflict of interest
To be declared by the author(s) before publication.
Funding
To be declared by the author(s) before publication.