1. Introduction
Few structures have taught developmental biologists as much as the wing bud of the chick. It forms on the flank of an embryo that can be reached through a window in the eggshell, it tolerates surgery, and the skeleton that results a week later reads like a record of what was done to it. Tissue can be removed, rotated or moved from one embryo to another, and beads soaked in a purified protein can be placed where a signalling centre would normally sit. Most of the concepts now used to describe vertebrate patterning, among them the organiser-like signalling centre and the graded positional signal, were worked out or sharpened in this system (Zeller et al., 2009).
The limb is patterned along three axes. The anteroposterior axis runs from the leading edge to the trailing edge of the wing, the proximodistal axis from shoulder to digit tip, and the dorsoventral axis from the back of the hand to the palm. Each axis has its own source of signals, and each was first defined by a grafting experiment before any molecule was known. Wolpert (1969) gave these observations a common language by proposing that cells acquire positional information from the local value of a graded signal and then interpret that value according to their own history.
For most of the period since, the distribution of signals and of the genes that respond to them has been mapped one transcript at a time by in situ hybridisation. Spatial transcriptomics changes the scale of that description, because it records the expression of thousands of genes at once while keeping each measurement tied to its place in the tissue. This review sets out the evidence on which the gradient account of avian limb patterning rests, the points on which the models disagree, and what spatially resolved expression profiling can reasonably be expected to add.
2. Scope and Approach
This is a narrative review of the published literature. It draws on the classical embryological papers on the chick wing, on the molecular studies that identified the signals, and on the methodological papers that introduced the main spatial transcriptomic techniques. Work in the mouse is included where it settled a question that the chick experiments had raised, and is identified as such, because the two species differ in digit number and in the tools available. No systematic search was carried out and no claim of completeness is made. The selection favours experiments that tested a model directly over descriptive reports of expression patterns.
3. Classical Evidence from the Chick Wing
The three signalling centres of the limb bud were each discovered by asking what happens when a piece of the bud is removed or put somewhere else. The experiments are worth recalling in some detail, since every later model has had to account for them.
3.1. The apical ridge and outgrowth
The apical ectodermal ridge is a thickened strip of ectoderm along the distal rim of the bud. Saunders (1948) removed it at successive stages and found that the wing was truncated at a level that depended on the time of the operation. Early removal left only proximal elements, and later removal allowed progressively more distal ones to form. The result showed that the ridge is needed for outgrowth and that the parts of the limb are laid down in a proximal to distal sequence. It did not show whether the ridge instructs cells about their position or simply keeps the underlying mesenchyme alive and dividing, and that ambiguity runs through the later debate.
3.2. The polarizing region and digit pattern
A small block of mesenchyme at the posterior margin of the bud has a property that no other part of the bud shares. When Saunders and Gasseling (1968) grafted it to the anterior margin of a host wing bud, the host formed a second set of digits in mirror image to the normal set. The grafted tissue contributed little to the extra digits, which meant that it was acting on its neighbours. This zone of polarizing activity became the textbook case of a local source of positional signal.
Tickle et al. (1975) then showed that the response was graded. Grafts placed at different positions along the margin, or weakened so that fewer active cells were delivered, produced duplications of different extent, with the most posterior digit forming closest to the graft and requiring the strongest signal. The simplest reading was that the polarizing region releases a diffusible substance whose concentration falls with distance, and that cells form a particular digit according to the concentration they experience. The later finding that a bead soaked in retinoic acid could imitate a polarizing graft seemed for a time to identify the substance (Tickle et al., 1982).
3.3. Dorsoventral polarity
The third axis is controlled by the ectoderm that covers the bud. Rotating the ectodermal jacket relative to the mesenchyme reverses the dorsoventral character of the distal structures that form beneath it, which places the source of the signal in the ectoderm and the response in the mesenchyme. The molecular basis of this interaction was among the first to be resolved, as described below.
4. Molecular Identity of the Signals
The 1990s supplied molecules for each of the three centres. Riddle et al. (1993) found that the gene sonic hedgehog is expressed in the polarizing region and that cells engineered to express it cause mirror-image duplications when placed at the anterior margin. Retinoic acid, it turned out, acts upstream by inducing sonic hedgehog expression. Purified SHH protein on a bead reproduces the graded response: Yang et al. (1997) showed that the identity of the extra digits depends on both the dose applied and the length of time the bead is left in place. Current knowledge of SHH in the limb is reviewed by Tickle and Towers (2017).
For the ridge, Niswander et al. (1993) demonstrated that beads carrying FGF4 can substitute for it after surgical removal, sustaining outgrowth and allowing distal elements to form. Several fibroblast growth factor genes are expressed in the ridge, and they act together. For the dorsoventral axis, Riddle et al. (1995) showed in the chick that WNT7A, produced by dorsal ectoderm, induces the LIM homeobox gene LMX1 in the mesenchyme beneath it, and that misexpression of either gene on the ventral side converts ventral structures to a dorsal character. Figure 1 summarises the sources, signals and outputs for the three axes.
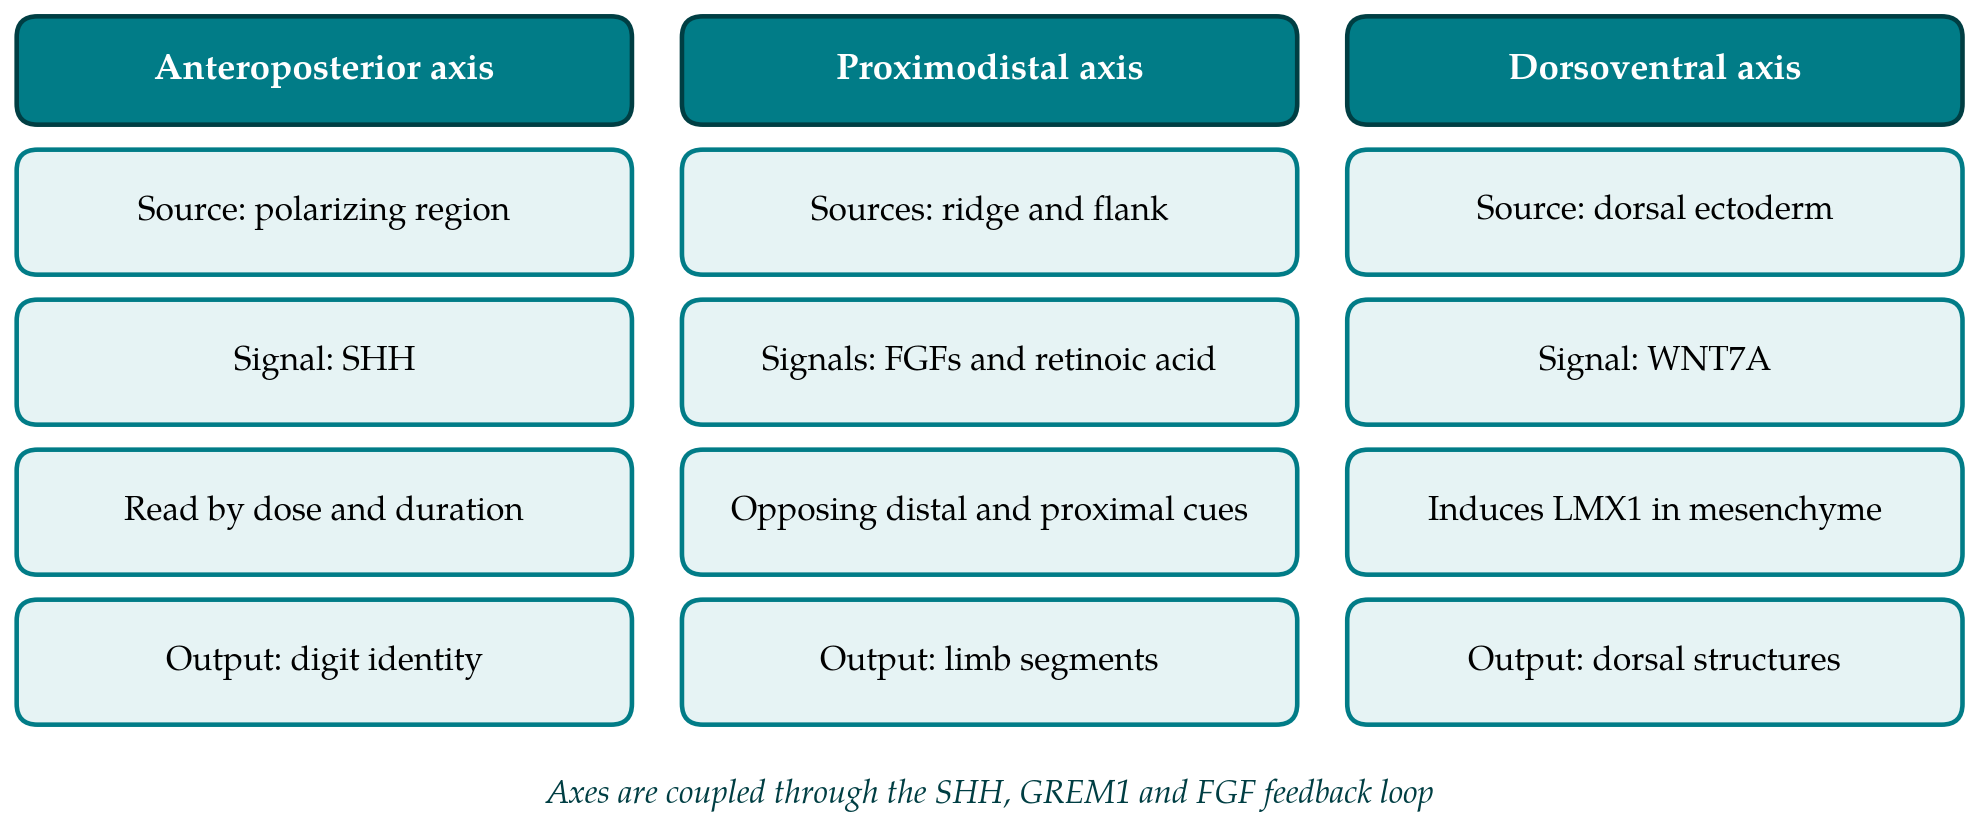
The centres do not work in isolation. Laufer et al. (1994) found that SHH induces FGF4 in the posterior ridge and that FGF from the ridge in turn maintains SHH expression in the polarizing region. This positive feedback loop, later shown to be relayed through the BMP antagonist GREM1 in the mesenchyme, couples the signal that specifies digit pattern to the signal that drives outgrowth (Zeller et al., 2009). The dorsal signal feeds into the same circuit, since SHH expression is reduced when WNT7A is lost. A limb bud is therefore better described as a self-regulating network of three linked gradients than as three independent coordinate systems.
5. How Cells Read the Gradients
Knowing the molecules did not settle how they are interpreted, and for two of the three axes the argument has continued for decades.
5.1. Concentration, time and growth on the anteroposterior axis
The original model held that the concentration of SHH alone specifies digit identity. Two findings complicated it. Genetic fate mapping in the mouse by Harfe et al. (2004) showed that the most posterior digits are built largely from descendants of cells that themselves expressed sonic hedgehog, and that these digits differ in how long their precursors went on expressing it. Identity in that part of the limb therefore reflects the duration of signalling as well as its level. In the chick wing, Towers et al. (2008) separated two roles of SHH by using inhibitors of the pathway and of the cell cycle: it specifies positional values early, and it also controls the width of the field of cells available to form digits. Specification and growth are integrated, so that the same signal sets both the kind and the number of digits.
5.2. Progress zone, early specification and two signals
For the proximodistal axis, Summerbell et al. (1973) proposed that cells measure the time they spend in a progress zone beneath the ridge and adopt more distal fates the longer they stay there. The model explained the truncations seen after ridge removal. Dudley et al. (2002) challenged it with fate maps and an analysis of cell death after ridge removal, arguing that the segments are specified early and that truncations reflect the loss of already specified distal progenitors.
A third account gives the instructive role to two opposed diffusible signals. Mercader et al. (2000) found that retinoic acid from the proximal side promotes expression of the MEIS genes, which mark the future upper limb, while FGF from the ridge restricts them. Two studies in the chick then tested the idea directly. Cooper et al. (2011) and Roselló-Díez et al. (2011) exposed limb mesenchyme to defined combinations of signals or moved distal tissue into retinoic acid rich surroundings, and both concluded that the main proximodistal subdivision is set by the balance of trunk-derived and ridge-derived signals and not by a cell-autonomous clock. Whether an intrinsic timing mechanism contributes to the later, more distal subdivisions is still debated.
Gradients may also act on patterning systems that are not themselves gradients. Work in the mouse by Raspopovic et al. (2014) modelled the periodic arrangement of digits as the output of a reaction and diffusion network involving BMP, SOX9 and WNT, with the FGF gradient from the ridge tuning the wavelength of the pattern as the handplate widens. On this view positional gradients and self-organising networks cooperate, and the question for any given gene becomes which of the two kinds of input it is reading.
6. What Spatial Transcriptomics Adds
Each of the models above makes claims about where and when sets of genes respond to a signal. Testing them with single-gene in situ hybridisation is slow, and comparing patterns between embryos introduces error. Dissociating the bud for single-cell RNA sequencing gives the full transcriptome of each cell, and a single-cell atlas of the developing chicken limb is available (Feregrino et al., 2019), but dissociation discards the very information a gradient model is about, namely position.
Spatial transcriptomic methods keep it. They fall into two broad families, compared in Table 1 together with the two older approaches. In capture-based methods a tissue section is laid on a surface carrying oligonucleotides that bind messenger RNA and add a barcode identifying the location. The original implementation used printed spots a tenth of a millimetre across (Ståhl et al., 2016), and later versions replaced the spots with much smaller barcoded beads (Rodriques et al., 2019). In imaging-based methods, transcripts are detected in place by repeated rounds of hybridisation and imaging with an error-correcting code, as in MERFISH (Chen et al., 2015). The trade-offs between coverage, resolution and sensitivity are discussed by Rao et al. (2021).
| Approach | Principle | Strength for gradient questions | Main limit |
|---|---|---|---|
| In situ hybridisation | Labelled probe detects one transcript in whole buds or sections | Full view of pattern and shape of the bud | One or a few genes per embryo |
| Single-cell RNA sequencing | Bud is dissociated and each cell profiled (Feregrino et al., 2019) | Whole transcriptome, cell states resolved | Position is lost |
| Spot-based capture | Section on barcoded array (Ståhl et al., 2016) | Unbiased, many genes, position kept | Each spot pools several cells |
| Bead-based capture | Section on small barcoded beads (Rodriques et al., 2019) | Near-cellular resolution | Few transcripts captured per bead |
| Multiplexed imaging | Sequential hybridisation with coded probes (Chen et al., 2015) | Single-cell and subcellular detail | Gene panel chosen in advance |
Three uses seem well matched to the open questions. The first is to measure, across a whole section, how the expression of known target genes changes with distance from a source, and to do so for many targets in the same tissue. The response to SHH, for example, is usually inferred from a handful of readouts such as PTCH1 and GLI1; a transcriptome-wide profile along the anteroposterior axis would show which genes follow the signal smoothly and which switch at a boundary. The second is to place the cell states defined by single-cell sequencing back into the bud by computational mapping, which turns an atlas of states into a map. The third is to compare stages. Because the Hamburger and Hamilton staging of the chick allows embryos to be matched closely, sections from successive stages can be aligned to follow how a domain of expression moves as the bud grows.
The limits deserve equal weight. A limb bud at the stages when its axes are specified is small, and a section through it covers few capture spots in the coarser formats, so that a gradient may be sampled at only a handful of positions. The finer formats recover fewer transcripts per location, and genes for signalling ligands and transcription factors are often expressed at low levels. A section is also a two-dimensional sample of a three-dimensional pattern, and the three axes of the bud cannot all lie in one plane. Most importantly, these methods measure messenger RNA. They report where a ligand is transcribed and where its targets respond, and they do not report the distribution of the protein, which is the gradient itself.
7. Gaps and Future Work
Several questions follow from the literature reviewed here. The quantitative shape of the SHH response in the chick wing, and how it changes over the hours in which positional values are being set, has not been described at the level of the whole transcriptome. The relative contributions of timing and of opposing signals to the distal subdivisions of the proximodistal axis are unresolved. The points at which the dorsoventral system feeds into the other two are known for a few genes only.
The avian embryo has a specific advantage for addressing them: a bead or a graft can be applied to one wing bud while the other serves as an untreated control in the same embryo and on the same section. Combining that classical design with spatially resolved profiling would allow the transcriptional response to a defined change in signal to be read out across the tissue. Such studies will need validation by an independent method, careful treatment of section plane and stage, and the open deposition of raw and processed data so that maps from different laboratories can be compared.
8. Conclusion
More than seven decades of experiments on the chick limb bud have established that three linked signalling centres pattern its axes, that the signals they produce are graded, and that cells respond to the level and the duration of exposure in ways that are coupled to growth. The models that describe how gradients are read remain contested in their details, and the disagreement is largely about spatial and temporal patterns of gene response that have been hard to measure comprehensively. Spatial transcriptomics offers a way to measure them. Its value in this field will depend on resolution and sensitivity adequate to a very small tissue, and on pairing the new measurements with the experimental manipulations that made the chick limb informative in the first place.
Conflict of interest
To be declared by the author(s) before publication.
Funding
To be declared by the author(s) before publication.