1. Introduction
A working quarry is a slope stability problem that renews itself every week. Each blast produces a face whose joints, faults and weathering have never been seen before, and decisions on face angle, bench width, scaling and the direction of advance depend on reading that exposure correctly. The standard way of reading it is the scanline or window survey, in which a geologist records every discontinuity crossing a tape or lying within a marked area (Priest and Hudson, 1981; ISRM, 1978). The method is well understood, and its drawbacks in a quarry are just as well known. Only the base of the face can be reached, the sample is small, and the work is done in the zone where rockfall is most likely.
Remote methods remove the access problem. Terrestrial laser scanning and close-range photogrammetry were shown more than a decade ago to yield discontinuity orientations comparable with compass measurements on rock cuts (Sturzenegger and Stead, 2009). Small drones carrying consumer cameras have since made photogrammetric survey cheap and quick (Colomina and Molina, 2014). What a quarry manager needs, however, is a rating that can be compared from face to face and fed into design, and a point cloud does not supply that by itself.
This article proposes a procedure that takes a drone survey through to a rock mass classification. It is addressed to quarry geologists and geotechnical engineers who already use one of the classification systems and wish to base it on a larger and safer sample. The procedure is proposed and described; it is not applied to a site here, and no survey results are reported.
2. Background
The procedure rests on two established bodies of method, which are summarised briefly before the stages are described.
2.1. Structure-from-motion photogrammetry
Structure from motion reconstructs three-dimensional geometry from overlapping photographs taken from different positions. Distinctive features are detected and matched between images, typically with descriptors of the kind introduced by Lowe (2004); camera positions and a sparse set of points are solved together by bundle adjustment; and multi-view stereo matching then densifies the result. Westoby et al. (2012) introduced the approach to the geosciences as a low-cost alternative to laser scanning, and James and Robson (2012) quantified the accuracy attainable with consumer cameras. The model has no inherent scale or orientation, so both must be supplied through surveyed control points or accurate camera positions. James and Robson (2014) showed that image sets taken with parallel viewing directions can produce a systematic doming of the model, and that including convergent, oblique images largely removes it.
2.2. Rock mass classification
Four systems are in common use for rock slopes and excavations. The Rock Mass Rating sums ratings for intact strength, rock quality designation, discontinuity spacing, discontinuity condition and groundwater, with an adjustment for orientation (Bieniawski, 1989). The Q-system combines six parameters describing block size, inter-block shear strength and active stress (Barton et al., 1974). The Geological Strength Index is estimated from a chart of structure against surface condition and feeds the Hoek-Brown criterion (Hoek and Brown, 1997; Marinos and Hoek, 2000). The Slope Mass Rating adds to the basic Rock Mass Rating a set of factors for the geometric relation between joints and slope face and for the method of excavation (Romana, 1985). All four were devised for use by an observer at the rock, and their inputs mix geometry with properties that have to be felt, scratched or struck.
3. The Proposed Procedure
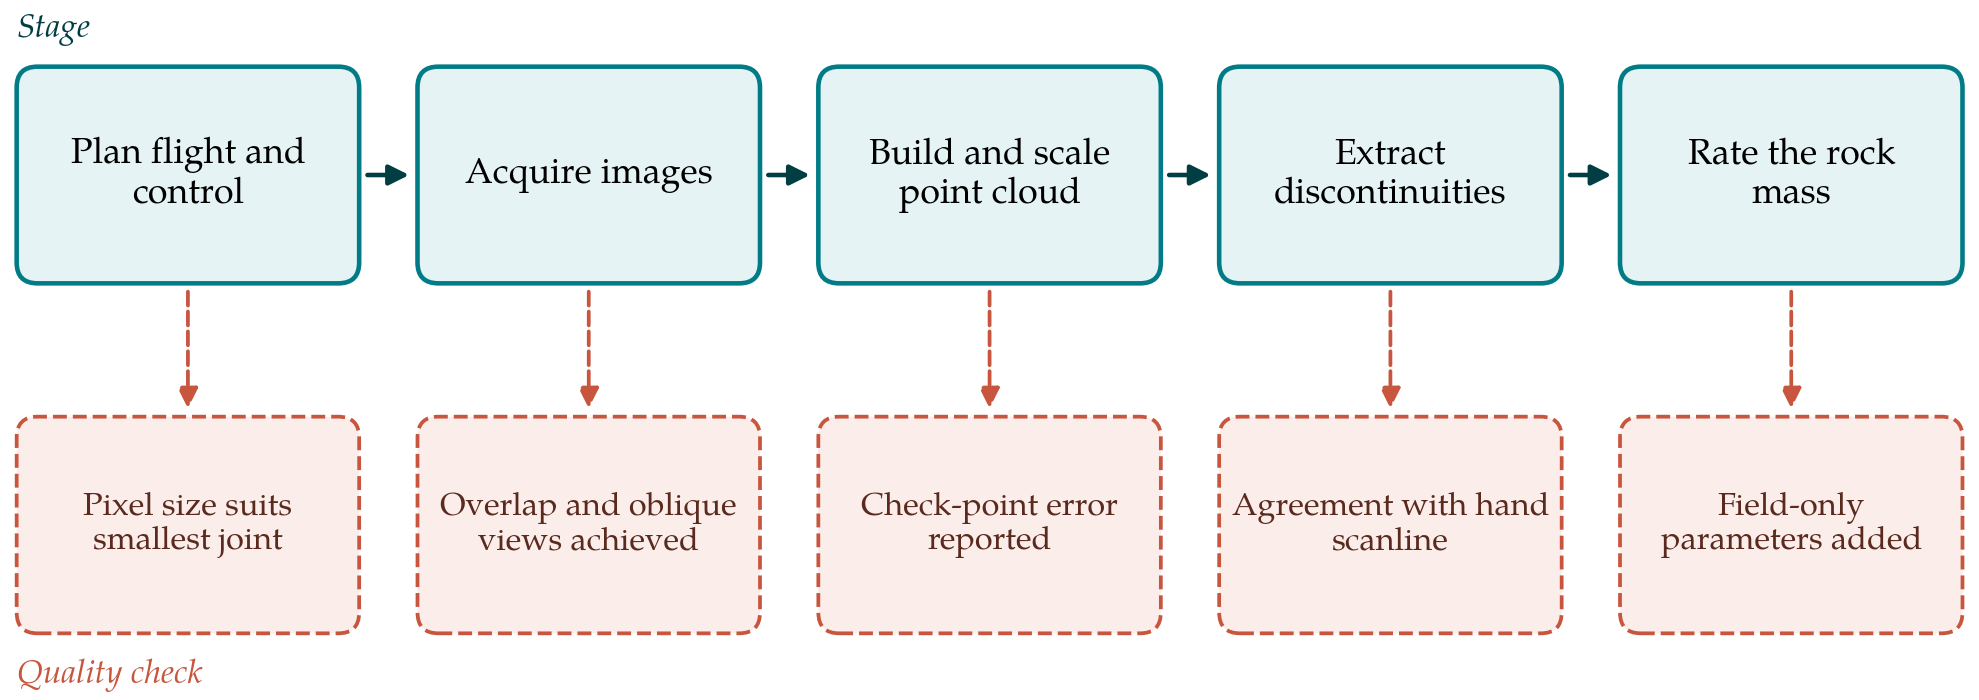
The procedure has five stages, each with a check that must be passed before the next begins. Figure 1 shows the stages and their checks.
3.1. Stage 1: Plan the flight and the control
Planning starts from the smallest feature that must be resolved. If joints spaced a few centimetres apart are to be distinguished, the ground sampling distance on the face must be several times smaller than that spacing, and this fixes the stand-off distance for a given camera. Flight lines are laid out parallel to the face at two or more heights, with a second pass in which the camera is tilted to view the face obliquely from each side. Control targets are placed on the crest and the quarry floor, and where it is safe on intermediate benches, and surveyed by total station or satellite positioning. Some are held back as independent check points. The check for this stage is that the planned pixel size suits the smallest discontinuity spacing of interest.
3.2. Stage 2: Acquire the images
Images are taken with high forward and side overlap, at a fixed focal length, with exposure set to freeze motion and to hold detail in both shadow and sunlit rock. Even, overcast light is preferable to low sun, which hides joint surfaces that face away from it. A face is best flown soon after blasting and scaling, before dust and muck obscure the lower part. Before leaving the site the operator confirms that the intended overlap was achieved and that the oblique passes cover overhangs and re-entrants, since a gap cannot be repaired in processing.
3.3. Stage 3: Build and scale the point cloud
The images are processed to a dense point cloud in any of the established structure-from-motion packages, and the model is georeferenced with the control targets. The residuals on the independent check points are the honest measure of accuracy and should be reported with every survey. True north matters as much as scale, because every orientation taken from the cloud inherits any rotation of the model. The cloud is then cleaned of vegetation, plant and loose debris, and subsampled to a uniform density so that later statistics are not weighted towards the parts of the face nearest the camera.
3.4. Stage 4: Extract the discontinuities
Discontinuities appear in a point cloud in two ways: as exposed planar surfaces and as traces where a plane cuts the face. Planar surfaces can be segmented semi-automatically. Riquelme et al. (2014) described a method that computes a normal at each point, finds the principal orientations by density analysis and clusters the points belonging to each plane, and Dewez et al. (2016) provided a comparable facet-extraction tool within the open-source CloudCompare software. Traces are better handled by assisted digitising of the kind described by Thiele et al. (2017). From the segmented planes and traces the geologist obtains orientation sets, normal set spacing and trace length.
Three sampling biases must be dealt with. Sets that strike nearly parallel to the face and dip into it are under-represented, and the correction of Terzaghi (1965) applies to a face as it does to a scanline. Trace lengths are censored by the height of the bench. Surfaces hidden from every camera position are absent. The check for this stage is a comparison with a short conventional scanline at a safe, accessible location: the sets identified in the cloud should match those measured by compass, and any set seen by hand but missing from the cloud must be explained.
3.5. Stage 5: Rate the rock mass
The last stage converts the extracted geometry into classification inputs and adds what the cloud cannot give. Table 1 sets out, for each input, whether it can be taken from the point cloud and what field supplement is needed. Geometric parameters transfer well. The rock quality designation was defined for drill core, but it can be estimated from the volumetric joint count through the correlations discussed by Palmström (2005), and the joint count follows directly from set spacings. The orientation adjustment in the Rock Mass Rating and the geometric factors in the Slope Mass Rating are functions of the angles between each set and the face, which the cloud provides for the whole face and not just its base.
| Input | From the point cloud | Field supplement |
|---|---|---|
| Orientation of sets | Yes, for exposed planes and traces | Compass check on a short scanline |
| Spacing and joint count | Yes, as normal set spacing | None beyond the scanline check |
| Persistence | Yes, as trace length up to bench height | Note terminations seen at the face |
| Rock quality designation | Indirectly, from volumetric joint count | Core, where drilling exists |
| Large-scale roughness | Yes, waviness of exposed surfaces | None |
| Small-scale roughness, aperture, infilling | No, below the resolution of the model | Hand inspection of accessible joints |
| Intact strength and weathering | No | Hammer or point load tests; visual grade |
| Groundwater | Partly, seepage visible in images | Inspection after rain |
The parameters that describe the condition of joint surfaces are a different matter. Small-scale roughness, wall alteration, aperture and infilling lie below the resolution of any practical drone survey, and intact strength cannot be seen at all. These are recorded by hand on accessible joints of each set, at the scanline used for the Stage 4 check and at fallen blocks that can be matched to a set. The Geological Strength Index, being a visual chart, can be assigned from the textured model for structure and from the hand observations for surface condition. The rating sheet should mark each input as measured from the cloud, measured by hand or assumed, so that a reader can see how much of the final number rests on each.
4. Fitting the Procedure to Quarry Operations
The procedure is designed around the blast cycle. Control targets on the crest and floor can be permanent, so that a repeat survey needs only the flight and the processing. Successive clouds of an advancing face, registered to the same control, build up a three-dimensional record of how joint sets and faults continue into the rock, which is of direct use in planning the next blast and in recognising a persistent adverse structure before it daylights. The same clouds serve volume measurement and rockfall-source mapping, which spreads the cost of the survey.
Two organisational points deserve attention. Drone flights are subject to national aviation rules and to the quarry's own safety system, and the flight plan should be part of the site's routine permitting. And the person who rates the rock mass should be the person who visited the face, or should work alongside them. A classification assembled wholly at a desk from a model loses the judgement the systems were designed to capture.
5. Limitations and What Remains to Be Shown
This article proposes the procedure and does not validate it. Three matters need evidence. The first is agreement: whether ratings derived through the procedure match those of an experienced mapper with full access to the same face, and whether any difference is systematic. The second is the effect of the hybrid sample, in which geometry comes from the whole face and surface condition from a few accessible joints at its base; if condition varies with height or weathering, the rating will be biased. The third is time, since the claim that the method is rapid depends on processing and interpretation as much as on the flight.
There are also limits that further work will not remove. Photogrammetry sees surfaces, and a tightly closed joint with no exposed plane and a faint trace may be missed. Wet, dusty or uniformly coloured rock gives poor image matching. Semi-automatic extraction finds planes whether or not they are geological, and blast-induced fractures have to be separated from natural joints by a geologist. The procedure enlarges and protects the mapper's sample. It does not replace the mapper.
6. Conclusion
Drone photogrammetry can supply the geometric half of a rock mass classification for an entire quarry face, from a safe distance and within a working shift, and published tools exist for each processing step. The other half, the condition and strength of the joints and the rock, still has to be observed by hand. The five-stage procedure proposed here keeps the two halves distinct, attaches a quality check to every stage and records the origin of each input. Whether it yields ratings as reliable as conventional mapping, in less time, is a question for field trials that this article has not carried out.
Conflict of interest
To be declared by the author(s) before publication.
Funding
To be declared by the author(s) before publication.