1. Introduction
Predictive policing is the use of statistical models to direct police resources to places or people judged likely to be involved in crime in the near future. An influential overview from the RAND Corporation sorted the methods into those that forecast places and times of crime and those that identify individuals at risk of offending or victimisation (Perry et al., 2013). The place-based variant grew out of two decades of research on crime concentration, which found that a small share of addresses and street segments accounts for a large share of recorded incidents (Sherman et al., 1989). Commercial products followed, the best known built on a point-process model adapted from seismology (Mohler et al., 2011).
Evaluation has been framed accordingly. The usual question is whether the model places more future crimes inside its flagged areas than a rival method does, and secondarily whether crime falls when patrols follow the forecasts. A field trial reported that the algorithm outperformed crime analysts on the first measure (Mohler et al., 2015); an independent evaluation of a different programme found no significant effect on property crime (Hunt et al., 2014). Both kinds of study take the crime record as the yardstick. This article argues that the yardstick itself has to be examined first, and that the tools for doing so are sociological.
2. What an Accuracy Test Presupposes
To call a forecast accurate is to say that it agrees with what later happened. In predictive policing what later happened is known only through the police record: calls for service, incident reports, arrests. The test therefore compares predictions made from police records with later police records. It measures the model's ability to anticipate the record. It measures the ability to anticipate crime only on the further assumption that records track offending evenly across places and groups.
That assumption is rarely stated and has long been known to be false. The error is not random noise that more data will average away. It is structured by the same social processes that determine where police are sent, and a model trained and scored on the same biased source will be rewarded for learning the bias.
3. Recorded Crime as a Social Product
Kitsuse and Cicourel (1963) proposed that official statistics be read as indices of the organisations that produce them and not of the behaviour they claim to count. A rate of recorded delinquency, on their account, reports how agencies define, notice and process conduct. Black (1970) gave the argument empirical content by observing encounters between patrol officers and citizens. Whether an officer wrote an official report depended on the legal seriousness of the incident and also on the complainant's stated preference, the complainant's deference and the social distance between complainant and suspect. A crime rate, he concluded, is a social fact in its own right.
The same period produced the notion of the dark figure. Biderman and Reiss (1967) argued that every method of counting crime, police records and victim surveys alike, institutionalises a particular way of seeing, and that none gives access to a true total. Later work stressed that the unrecorded portion is not a uniform fraction (Skogan, 1977). Offences that are usually reported by victims, such as burglary or vehicle theft, are recorded more completely than offences that come to light mainly through police initiative, such as drug possession, weapons carrying or disorder. For the second kind the record is close to a log of where officers were looking.
Later scholarship on information systems generalised the point. Classification schemes embed the purposes and compromises of the institutions that maintain them, and talk of raw data hides the work of collection, coding and cleaning that makes data usable at all. boyd and Crawford (2012) warned at the start of the big data period that scale does not confer objectivity. Table 1 applies these ideas to the stages through which an event becomes a row in a police database.
| Stage | Social process involved | Question to ask before testing accuracy |
|---|---|---|
| Occurrence | Not observed directly by any data system | What independent evidence of offending exists for this area? |
| Reporting | Victims decide whether to call, shaped by trust in police | Do reporting rates differ across neighbourhoods and groups? |
| Discovery | Officers find offences where they patrol and whom they stop | What share of records is police-initiated? |
| Recording | Officer discretion; complainant preference (Black, 1970) | Which incidents are attended but never written up? |
| Classification | Offence codes, targets and audit rules | Have categories or counting rules changed over time? |
| Location coding | Addresses geocoded, often to station or stop site | Does the mapped point mark the offence or the encounter? |
| Retention and reuse | Records merged, purged or carried into new systems | Are records from unlawful practices still in the data? |
4. The Loop Between Forecast and Record
A predictive system adds something that the sociologists of the 1960s did not have to consider. Its output changes the conditions under which its future input is produced. Figure 1 shows the cycle. Patrols are sent where the model points. Officers present in an area detect and record incidents there that would have gone unrecorded elsewhere. The new records enter the training data and raise the area's forecast risk.
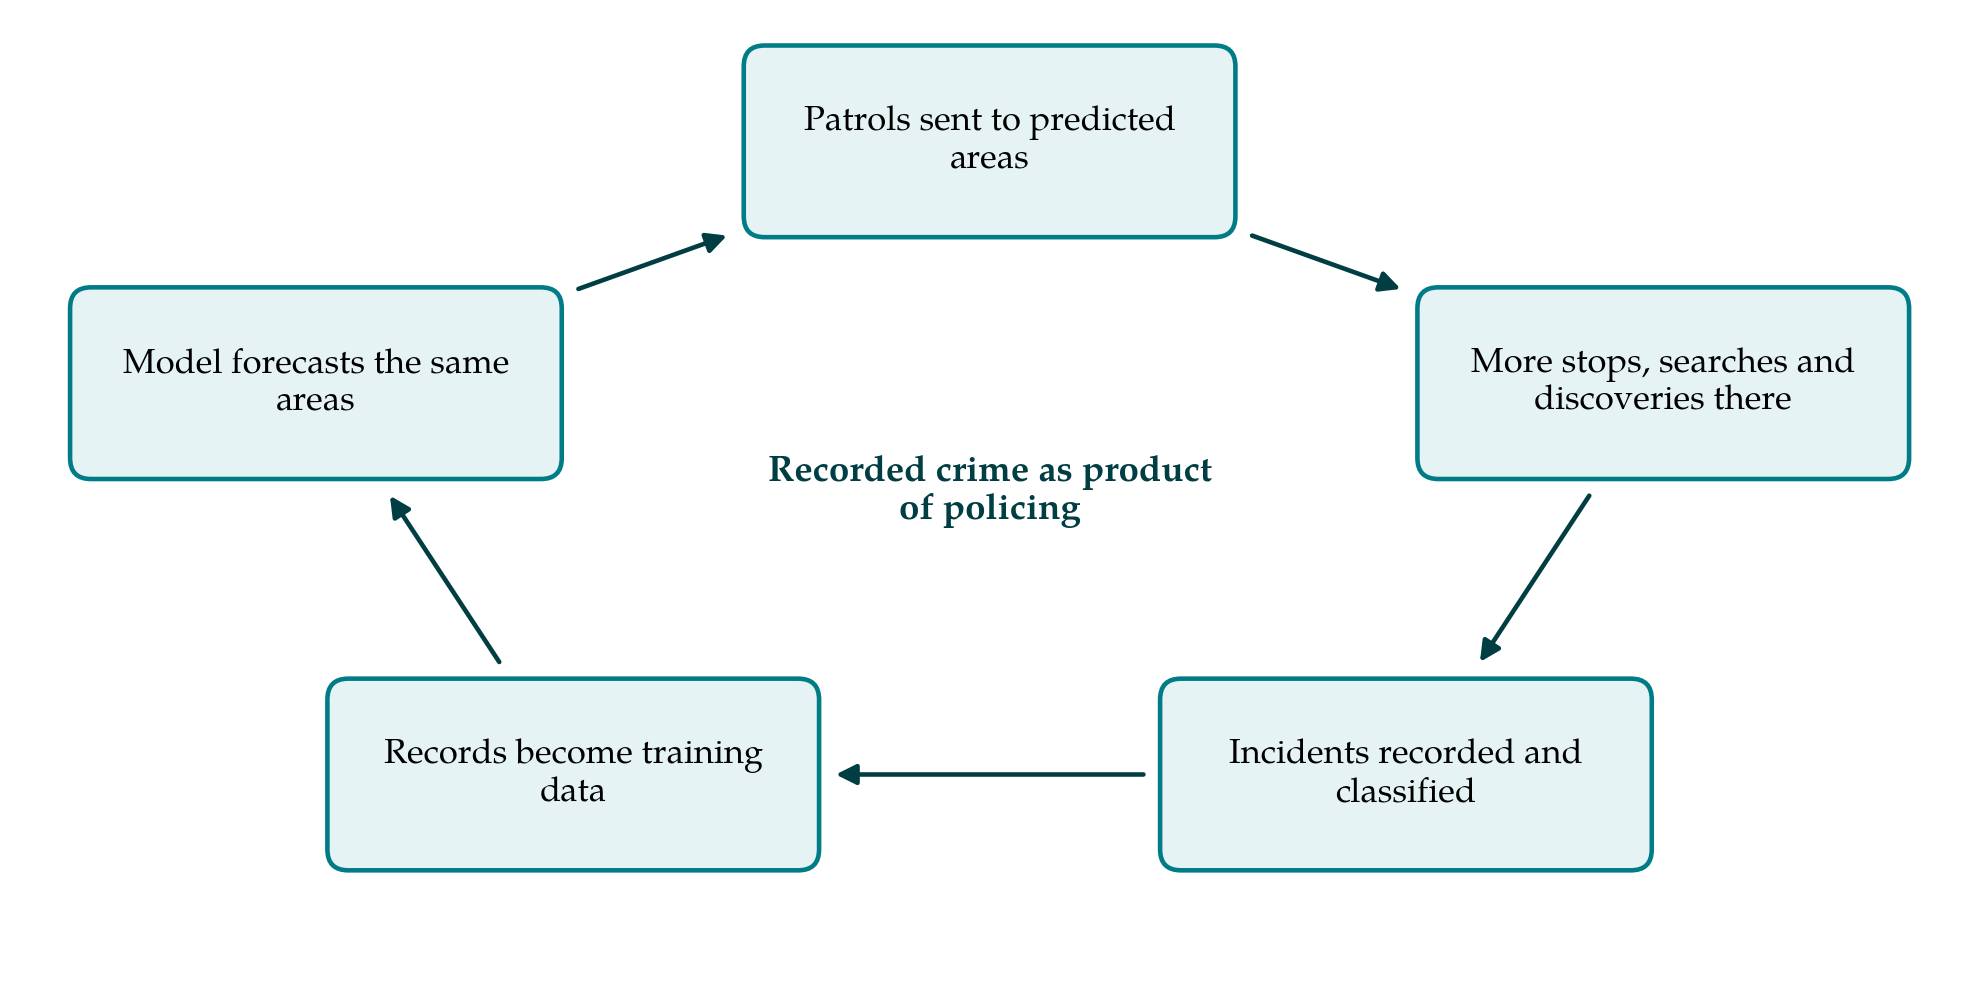
Lum and Isaac (2016) illustrated the mechanism by applying a published place-based algorithm to drug arrest records from one American city. The forecasts concentrated on neighbourhoods with large minority populations, although survey-based estimates suggested that drug use was spread much more evenly. Ensign et al. (2018) proved the general result with a simple urn model: when incidents are discovered only where police are sent, allocation converges on one area regardless of the true rates. In such a loop the standard accuracy test passes with ease, because the forecasts help to generate the records against which they are scored.
Ethnographic and legal research describes the same dynamics inside police organisations. Brayne (2017), observing a large American department, found that data-driven tools lowered the threshold for inclusion in police databases and merged previously separate record systems, so that a person's prior contact with police made further contact more likely. Richardson et al. (2019) examined jurisdictions where predictive systems were developed during periods of documented unlawful policing and argued that the resulting records, which they call dirty data, could not be treated as a neutral basis for prediction.
The reasoning applies with greater force to person-based systems. Lists that score individuals by risk draw on arrests, stops and recorded associations, nearly all of which originate with the police. A person who is stopped often accumulates entries, the entries raise the score, and the score is then offered as grounds for further stops. In that case the record is less a partial view of the person's conduct than a history of the department's attention to that person, and agreement between the score and later arrests confirms little beyond the persistence of that attention.
5. What a Sociology of Data Would Do First
The argument has a practical side. Before an accuracy test is designed, the records should be studied as an organisational product, by the ordinary methods of sociology. That means observing how incidents are taken, written up and coded in the department concerned; interviewing call handlers, officers and records staff about what is left out and why; tracing changes in offence definitions, performance targets and recording rules over the training period; and separating citizen-reported from police-initiated records, since the two have different relations to underlying events. Where victimisation surveys, hospital data or other independent sources exist, they should be compared with police records area by area.
The findings should be written down in a form that travels with the data. Proposals from within computer science for standard documentation of datasets (Gebru et al., 2021) point in this direction, but a form completed by the vendor is no substitute for fieldwork by people independent of both vendor and department. Only then can an evaluator decide which offence types and periods are fit to serve as training data and as ground truth, and for which a claim of accuracy would have no clear meaning.
6. Objections Considered
The first objection is that place-based systems avoid the problem by using only victim-reported offences. This is the strongest reply, and where it is true it narrows the concern considerably. But it has to be shown and not asserted. Reporting itself varies with trust in the police, the configuration of products changes between deployments, and the pressure to add offence types that are of interest to commanders is constant. Establishing which records are in fact used, and how they came about, is exactly the inquiry this article asks for.
A second objection holds that imperfect data still beat intuition: officers' hunches are biased too, and a model is at least consistent and open to inspection. The comparison is fair, yet it does not rescue the accuracy test. If model and officer are both scored against the same record, the test cannot tell which is closer to actual offending. A third objection is that randomised trials settle the matter by measuring crime reduction directly. Trials are valuable, but their outcome is again recorded crime, which deployment alters, and they say nothing about who bears the cost of added police attention (Bennett Moses and Chan, 2018).
A fourth response is technical: correct the bias statistically or impose fairness constraints. Barocas and Selbst (2016) show how many distinct routes lead from biased records to discriminatory output, and fixes confined to the model tend to fail when they abstract away the social setting in which it operates. A correction requires knowing the direction and size of the distortion, and that knowledge can come only from studying how the data were made. The objection therefore presupposes the sociology it hopes to bypass.
7. Implications
Three consequences follow for practice. Evaluations should state, for every offence type used, how records arise and what proportion is police-initiated, and should treat accuracy on police-initiated categories as uninterpretable. Procurement should require an independent audit of the records before any contract, with attention to periods in which the department's practices were found unlawful. Oversight bodies should ask for evidence about data production in the same breath as evidence about performance, and should be able to commission it. Harcourt (2007) argued, before the current generation of tools, that actuarial methods in criminal justice tend to ratchet up attention on groups already over-policed. A sociology of data is the means of checking whether a given system does so.
None of this implies that forecasting is impossible or that police records are worthless. It implies an order of work. Understanding the record comes first, the choice of what may be predicted comes second, and the measurement of accuracy comes third.
8. Conclusion
The claim that a predictive policing system is accurate has meaning only relative to a body of records, and those records are made by the institution whose activity the system directs. Sociology has understood crime statistics in this way for sixty years. The newer literature on algorithms confirms that the insight applies to machine learning without modification and that feedback from deployment sharpens it. Evaluating accuracy before examining the data mistakes agreement between a model and its own source for knowledge of crime. The sequence should be reversed.
Conflict of interest
To be declared by the author(s) before publication.
Funding
To be declared by the author(s) before publication.