1. Introduction
Real-time monitoring of the polymerase chain reaction, first described as kinetic PCR (Higuchi et al., 1993), turned an end-point technique into a quantitative one. The principle is simple enough to explain in a sentence: the more template a reaction starts with, the fewer cycles it needs to cross a fluorescence threshold. The simplicity is deceptive. Between the tissue and the number in a results table lie extraction, reverse transcription, primer behaviour, baseline setting, an assumption about amplification efficiency and a choice of reference, and each can move the answer by more than the biological effect under study (Nolan et al., 2006).
Because the instrument always returns a number, weak experiments are not self-announcing. A reader can tell a sound measurement from an unsound one only if the paper says how each of those intermediate steps was handled. That was the reasoning behind the MIQE guidelines, which set out the minimum information a publication should contain (Bustin et al., 2009). This article accepts that reasoning entirely. Its concern is practical: how a laboratory with few people and little infrastructure can meet the spirit of the guidelines without being defeated by their length.
2. Background
Two matters need to be set out before the checklist: what the existing guidance asks for, and why compliance has been poor where resources are thin.
2.1. What the guidelines ask
MIQE is organised as a table of items, each marked essential or desirable, covering experimental design, samples, nucleic acid extraction, reverse transcription, target information, oligonucleotides, protocol, validation and data analysis. It also fixed terminology, recommending the quantification cycle, Cq, in place of the several manufacturer-specific terms then in use, and reserving the phrase reference gene for what had loosely been called a housekeeping gene (Bustin et al., 2009). A shorter companion paper identified the subset of items that matter most for routine work (Bustin et al., 2010), a parallel guideline was later issued for digital PCR, and a revised version of the main guideline has since been published (Bustin et al., 2025).
2.2. Why small laboratories fall short
When the guideline authors examined the literature some years after publication, they found that reporting of the most basic items, such as RNA quality, the number and identity of reference genes and amplification efficiency, was still the exception (Bustin et al., 2013). The reasons are not mysterious. In a small group qPCR is usually a supporting technique and not the laboratory's specialism. Knowledge is passed from one student to the next. Commercial master mixes and predesigned assays work well enough that nobody is forced to understand them. And the full checklist, read cold, mixes items that need a decision at the design stage with items that are simply facts to be copied from a datasheet, without saying which is which. Practical guides to MIQE-compliant work exist, but most are written as laboratory protocols and still assume that someone has time to study them.
3. The Proposed Checklist
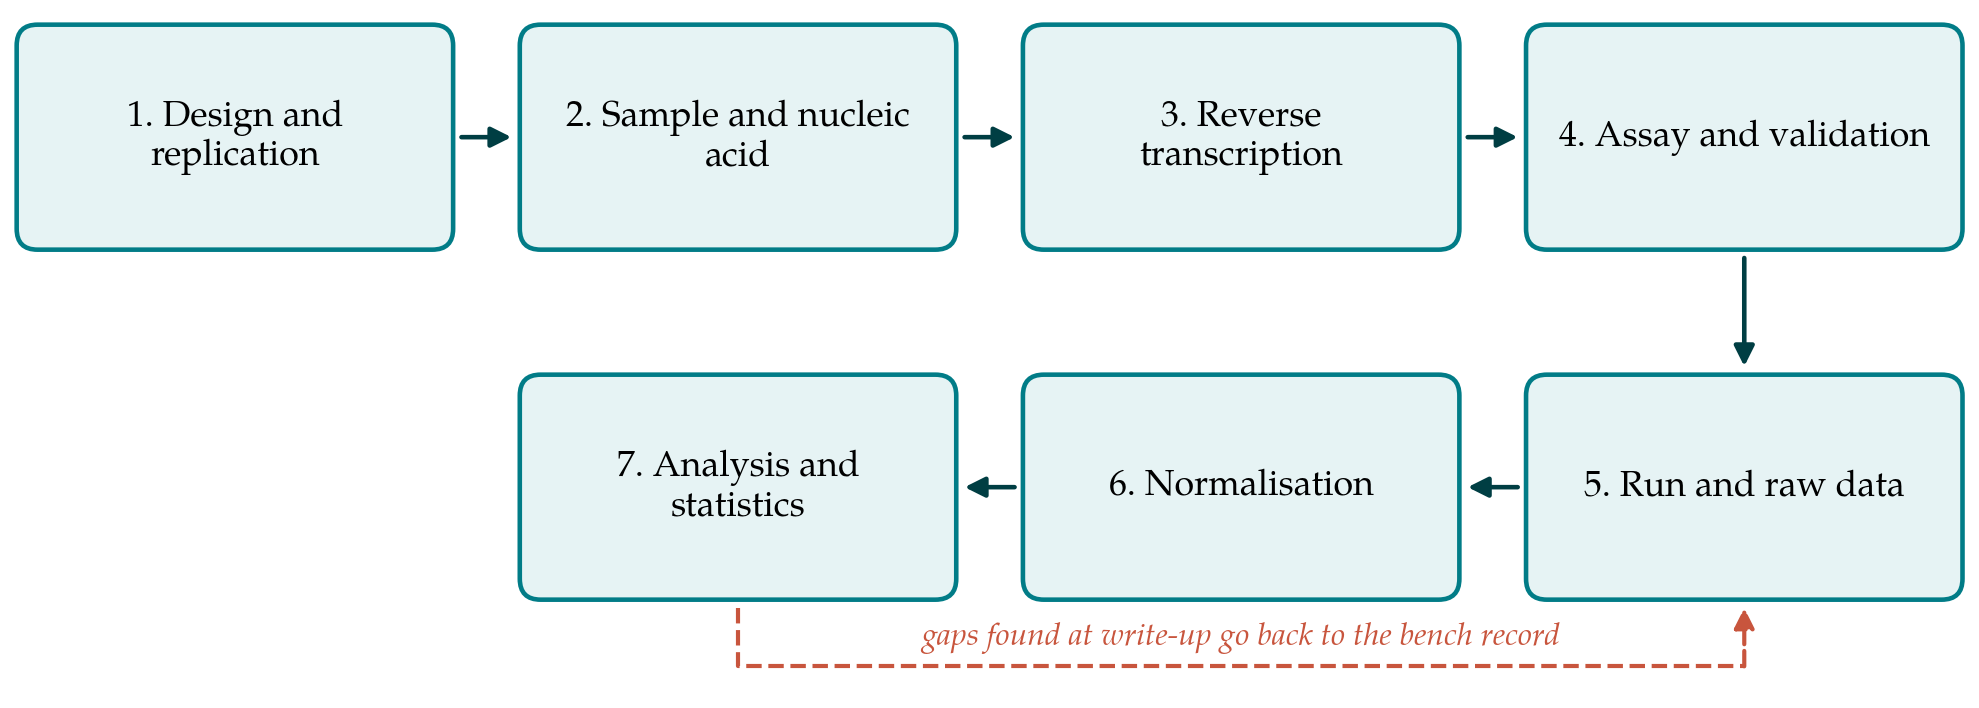
The proposal is to regroup the reporting requirements into seven stages that follow the order in which an experiment is actually carried out, and to attach to each stage a short list of things to write down at the time. Table 1 gives the stages, the core information to report for each and the reason a reader needs it. Figure 1 shows the stages in sequence. The checklist is deliberately shorter than MIQE. It is meant as a floor for laboratories that currently report much less, and nothing in it conflicts with the full guideline.
| Stage | Report at minimum | Why the reader needs it |
|---|---|---|
| 1. Design and replication | Groups, number of biological replicates, what a replicate is, controls included | Sets the population to which any inference applies |
| 2. Sample and nucleic acid | Source, storage, extraction method, quantity, purity and integrity assessment | Degraded or impure template biases Cq values |
| 3. Reverse transcription | Input amount, priming strategy, enzyme, whether a no-enzyme control was run | This step is the least reproducible in the workflow |
| 4. Assay and validation | Target accession, primer sequences, amplicon length, specificity check, efficiency | Allows the assay to be checked and repeated |
| 5. Run and raw data | Instrument, chemistry, reaction volume, cycling conditions, Cq method, no-template controls | Cq depends on instrument and software settings |
| 6. Normalisation | Reference genes used and the evidence that they are stable in these samples | An unstable reference creates or hides differences |
| 7. Analysis and statistics | Quantification model, handling of replicates and outliers, test used, software | Shows how Cq values became the reported result |
3.1. Stage 1: Design and replication
The first thing to record is what was compared with what and how many independent biological units stood behind each group. The distinction between biological and technical replication is the one most often blurred. Three wells pipetted from one cDNA preparation measure pipetting precision and nothing more, and a difference between two samples each run in triplicate has a sample size of one per group however small the error bars look (Vaux et al., 2012). The report should say plainly what the unit of replication was, an animal, a plant, a culture started on a different day, and which controls accompanied the experimental samples.
3.2. Stage 2: Sample and nucleic acid
A reader needs to know where the material came from, how it was preserved, how nucleic acid was extracted and how its amount and quality were judged. Integrity deserves a sentence of its own. Partly degraded RNA still amplifies, but it does so unequally across transcripts and amplicon positions, so comparisons between samples of different integrity are unsafe (Fleige and Pfaffl, 2006). Laboratories with access to capillary electrophoresis can report an RNA integrity number (Schroeder et al., 2006). Those without it should state what they did instead, for example inspection of ribosomal bands on a gel, and should not leave the matter unmentioned. Whether and how genomic DNA was removed belongs here too.
3.3. Stage 3: Reverse transcription
Conversion of RNA to cDNA is the step at which most of the technical variance in a two-step experiment enters. Yield depends on the enzyme, on whether priming is by oligo(dT), random oligomers or gene-specific primers, and on the amount of RNA put in (Stahlberg et al., 2004). The report should give all three, state that the same input amount was used across samples being compared or explain how unequal input was dealt with, and say whether reactions lacking reverse transcriptase were run to detect signal from contaminating DNA. Where a one-step format was used, in which reverse transcription and amplification share a tube, that should be said, since the two formats are not interchangeable when results from different studies are compared. It also helps the reader to know whether all samples in a comparison were reverse transcribed in the same batch, because batch-to-batch differences at this step are easily mistaken for biology.
3.4. Stage 4: Assay and validation
An assay that cannot be identified cannot be repeated. The database accession of the target, the primer sequences, any probe sequence and the amplicon length should be given, or for a commercial assay the supplier's identifier and whatever context sequence the supplier discloses. Two properties need evidence. Specificity can be supported in silico, with a tool such as Primer-BLAST (Ye et al., 2012), and empirically by a single melting peak or a product of the expected size. Amplification efficiency should be stated together with how it was estimated, because the estimate itself is imprecise when derived from a short dilution series (Svec et al., 2015).
3.5. Stage 5: Run and raw data
The instrument, the detection chemistry, the reaction volume and the cycling conditions are facts that cost nothing to report. So is the method by which Cq values were obtained. A Cq is not a property of the sample alone: it changes with the baseline correction and with where the threshold is placed, and different software makes these choices differently (Ruijter et al., 2009). The report should state the software and settings, give the results of the no-template controls, and wherever possible deposit the raw Cq values as a supplementary file so that the calculation can be repeated.
3.6. Stage 6: Normalisation
Normalisation to a reference gene corrects for differences in input and reverse transcription yield, and it is where published experiments most often go wrong. No gene is constitutively stable in every tissue and treatment. Vandesompele et al. (2002) showed that normalising to a single unvalidated reference can introduce large errors and proposed using the geometric mean of several references chosen for stable expression in the samples at hand. A model-based alternative for ranking candidates was given by Andersen et al. (2004). The checklist therefore asks for the reference genes by name, their number, and the evidence that they were stable under the conditions of the study. A statement that a gene is commonly used is not such evidence.
3.7. Stage 7: Analysis and statistics
Finally the report should say how Cq values were turned into the quantities shown in the figures. The comparative method of Livak and Schmittgen (2001) assumes that target and reference amplify with equal and near-perfect efficiency, and a paper that uses it should say that the assumption was checked. Where efficiencies differ, an efficiency-corrected model is appropriate (Pfaffl, 2001). The handling of technical replicates, any exclusion of wells and the rule applied, the scale on which statistics were computed and the test used all belong in the methods. Fold changes are ratios, and analysis on the logarithmic scale is usually the defensible choice (Schmittgen and Livak, 2008).
4. Fitting the Checklist to a Small Laboratory
The seven stages divide naturally into two kinds of record. Stages 1 and 6 require decisions that cannot be repaired afterwards: if only one biological replicate was collected, or if reference genes were never assessed in the tissue concerned, no amount of careful writing will supply the missing information. These are best settled at a short planning discussion before any sample is taken. The remaining stages mostly require facts to be captured while they are still at hand, and for them a single page kept with the run file, completed by whoever sets up the plate, is sufficient.
Much of stage 4 needs doing only once per assay. A laboratory can hold a validation sheet for each primer pair it uses, with sequences, accession, specificity evidence and efficiency, and cite or append it in every paper that uses the assay. Stage 5 is largely fixed by the instrument and the master mix and can be written once as a template paragraph. What remains variable from experiment to experiment is then small: the design, the sample quality, the reverse transcription inputs and the analysis. Presented this way the reporting burden for a routine experiment is a matter of minutes, and the checklist can be completed by a student without specialist supervision.
5. Limitations and What Remains to Be Shown
The checklist is a proposal. It has not been validated here or elsewhere, and three questions are open. The first is whether a shorter list raises the completeness of reporting in practice or merely lowers the target; that could be examined by comparing manuscripts prepared with and without it against the full MIQE table. The second is whether the items left out matter. The selection reflects a judgement about which omissions most often make a result uninterpretable, informed by the guideline authors' own short list (Bustin et al., 2010), and others might draw the line differently. The third is scope. The stages were written with relative quantification of messenger RNA in mind. Absolute quantification, microRNA assays, diagnostic applications and digital PCR raise further requirements that this guide does not cover.
A more general caution applies to all reporting standards. Complete reporting makes a weak experiment visible; it does not make it strong. A paper can list every item and still rest on a single reference gene of unknown stability. The checklist is useful only if editors, reviewers and supervisors read what is reported and act on it.
6. Conclusion
Most of what the MIQE guidelines ask of a routine gene expression experiment can be captured under seven headings that follow the course of the work. Two of them call for decisions at the planning stage, one can be dealt with once per assay, and the rest are records made at the bench. Arranged in that way the requirements are within reach of a laboratory of any size. Whether the arrangement improves reporting in practice has yet to be shown, and laboratories that adopt it are well placed to find out.
Conflict of interest
To be declared by the author(s) before publication.
Funding
To be declared by the author(s) before publication.