1. Introduction
Pit slopes move before they fail. Almost every large instability in an open pit is preceded by a period of measurable displacement, and slope management depends on finding that movement early, following its rate and withdrawing people and equipment in time (Read and Stacey, 2009). The instruments used for the purpose are well established: survey prisms read by robotic total stations, ground-based radar, extensometers across cracks and, at a broader scale, satellite radar interferometry. Each has gaps. Prisms give points and not surfaces, and somebody has to install them. Radar measures only the component of movement along its line of sight and is expensive enough that most mines cannot cover every wall.
Individual benches are where the gaps show. A wedge or planar slide involving one or two benches is too small to justify a dedicated radar and may lie between prisms, yet it can bury a ramp or reach a working area. Small unmanned aircraft, here called drones, already fly over most pits to measure stockpiles and excavation progress. Structure-from-motion photogrammetry turns their overlapping photographs into dense point clouds, without the calibrated metric cameras and rigid flight geometry that older photogrammetry required (Westoby et al., 2012; Colomina and Molina, 2014). Close-range photogrammetry has also proved useful for mapping the discontinuities that control bench-scale failure (Sturzenegger and Stead, 2009).
What is missing is a routine that turns repeated drone surveys into deformation measurements a geotechnical engineer can trust. This article proposes one, built for a weekly cycle. It is a proposal assembled from the published literature on photogrammetric error and topographic change detection. It has not been applied to a mine in this article, and no results are reported.
2. Background
Three bodies of work shape the design: the error behaviour of structure-from-motion surveys, methods for comparing point clouds, and the way displacement data are used to anticipate slope failure.
2.1. Where the error comes from
Structure from motion matches distinctive features between overlapping images, a step that rests on descriptors such as those of Lowe (2004), and solves at once for camera positions, camera calibration and a sparse set of three-dimensional points; dense matching then fills in the surface. James and Robson (2012) showed that, with adequate imagery, the precision achievable is a small fraction of the viewing distance, which at typical flying heights means a few centimetres. The important errors are systematic. Blocks of parallel, vertical images with a self-calibrated camera tend to produce a broad doming of the model, which James and Robson (2014) traced to error in the lens distortion estimate and showed could be reduced by adding convergent, oblique images. The number and placement of ground control points also governs accuracy, with control needed around the edge of the block and through its height range (Sanz-Ablanedo et al., 2018).
2.2. Comparing surfaces
Subtracting one gridded elevation model from another works on gentle terrain and fails on bench faces, where a small horizontal shift produces a large apparent change in height. The M3C2 algorithm of Lague et al. (2013) avoids gridding. It measures the distance between two clouds along the local surface normal, averages over a small cylinder to reduce noise, and attaches to every distance a confidence interval built from local roughness and registration error. The idea that change should be reported only above a level of detection derived from the errors of both surveys is standard in geomorphology (Wheaton et al., 2010), and James et al. (2017) extended it to photogrammetry by deriving maps of point precision from repeated bundle adjustments. Normal distances do not reveal movement parallel to the surface; for that, features can be tracked between orthomosaics by image correlation, as Lucieer et al. (2014) did for a landslide.
2.3. From displacement to warning
Slopes approaching failure commonly show accelerating creep, and Fukuzono (1985) observed that the inverse of velocity plotted against time trends towards zero near the time of failure. Rose and Hungr (2007) applied the method to open pit failures and discussed its pitfalls, and later work has given guidance on smoothing the data and setting alarm thresholds (Carlà et al., 2017). These analyses were developed for prism and radar records sampled many times a day. A weekly photogrammetric survey supplies far fewer points, and that sets firm limits on what it should be asked to do.
3. The Proposed Procedure
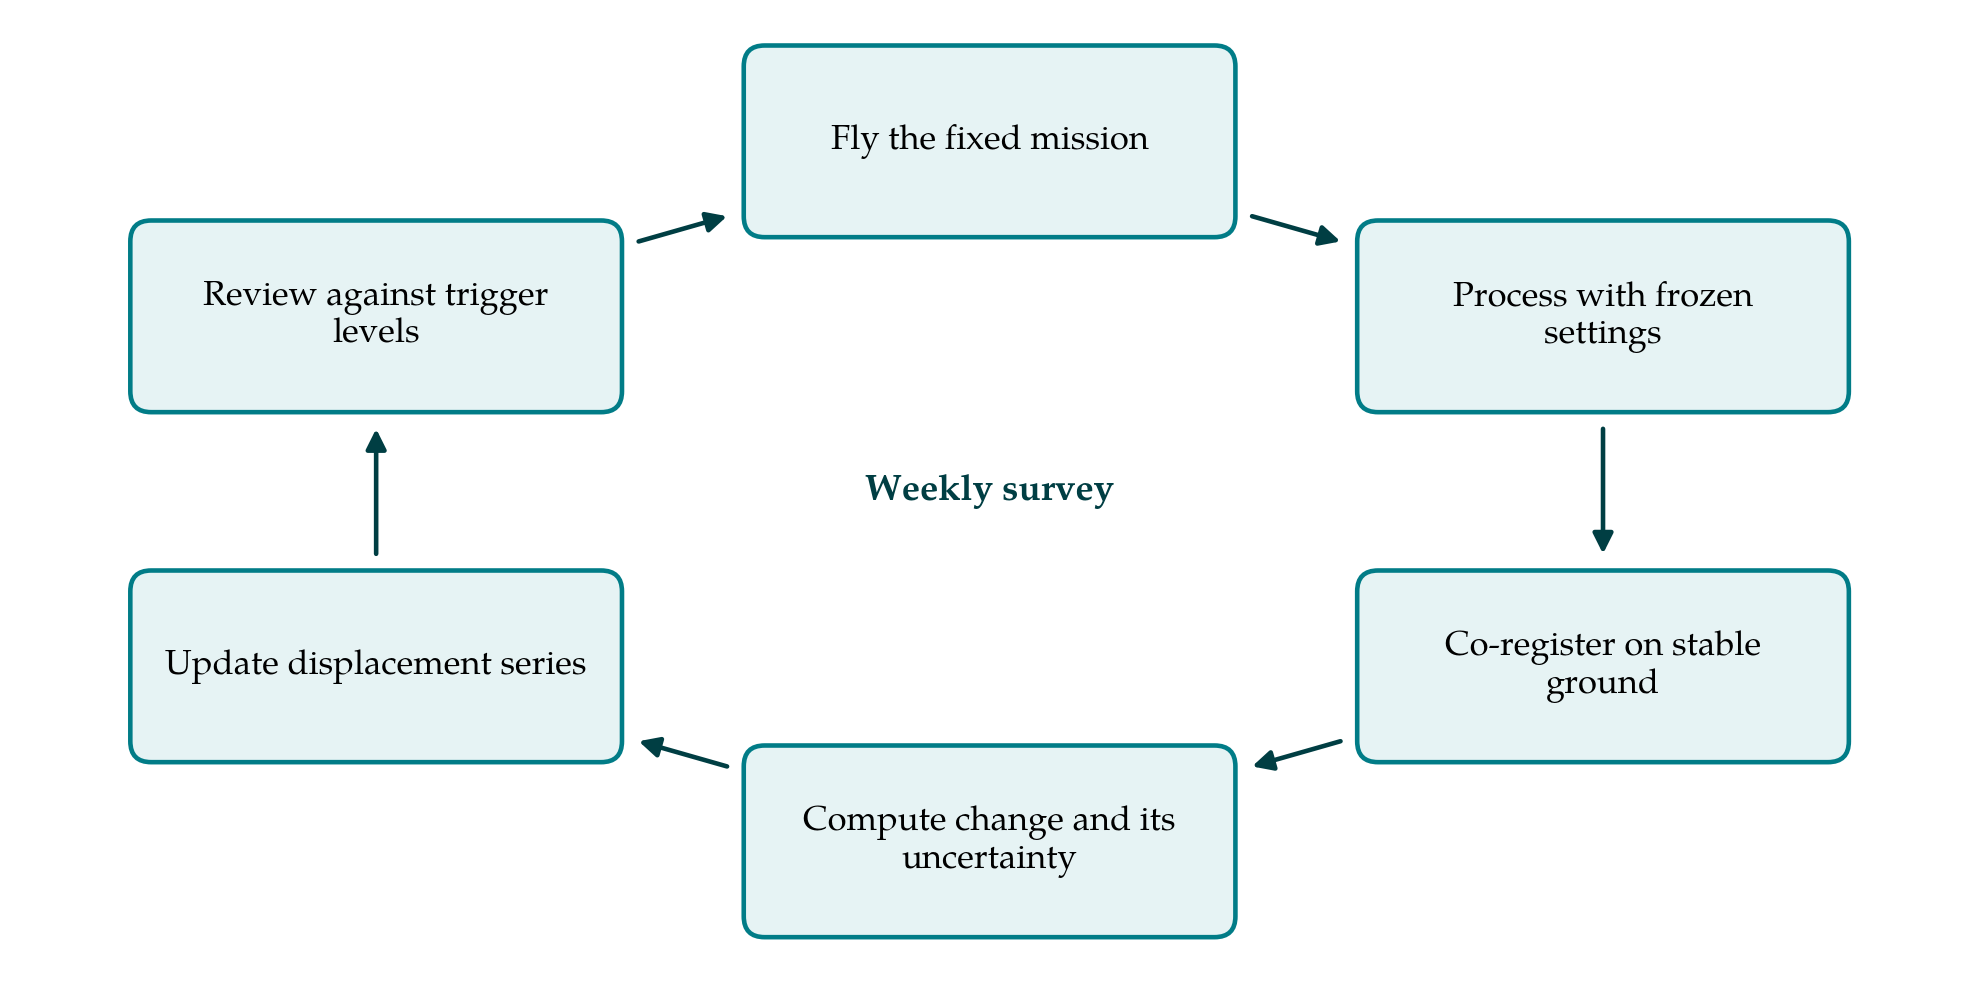
The procedure has seven steps. The first three are done once and revisited when the pit geometry changes; the remaining four repeat each week, as Figure 1 shows. Table 1 lists every step with the check that guards it and the product it yields.
| Step | Action | Quality check | Output |
|---|---|---|---|
| 1. Purpose | Define benches, mechanisms and smallest movement that matters | Compare with achievable precision | Monitoring brief |
| 2. Control | Install targets and reference patches on stable ground | Independent check points held back | Control register |
| 3. Flight design | Fix lines, height, overlap, oblique passes, time of day | Coverage and image sharpness review | Stored mission |
| 4. Processing | Run structure from motion with frozen settings | Check point residuals within tolerance | Dense cloud, orthomosaic |
| 5. Co-registration | Fine-align each epoch to the baseline on stable patches | Residual distance on patches near zero | Aligned cloud |
| 6. Change detection | M3C2 distances and image correlation vectors | Mask change below level of detection | Change map with confidence |
| 7. Interpretation | Accumulate series per zone; review against triggers | Cross-check with prisms or radar | Weekly note and action |
3.1. Step 1: Set the purpose and the detectable movement
The geotechnical engineer names the benches of concern, the failure mechanisms expected from the structural model, and the smallest displacement that would change a decision. That figure is compared with what photogrammetry can deliver at a practicable flying height. If the movement of interest is of the order of millimetres per week, the method is unsuitable and should not be used; if it is centimetres to decimetres, as is usual for bench-scale instabilities in their progressive stage, it is a candidate. Recording this reasoning protects against later over-reading of the data.
3.2. Step 2: Build control on stable ground
Permanent ground control targets are installed around and through the area, on ground judged stable and outside the influence of the benches being watched, and surveyed with the mine's total station or satellite positioning network. They should surround the block and span its vertical range, since pit walls have far more relief than the terrain on which most accuracy studies were done (Sanz-Ablanedo et al., 2018). A separate set of targets is held back as independent check points and never used in the adjustment. Aircraft with real-time or post-processed kinematic positioning reduce the number of targets needed but do not remove the need for checks. In addition, several patches of bare, stable rock are designated as reference surfaces for Step 5.
3.3. Step 3: Design one flight and keep it
A single mission is planned and stored: flight lines, height above the wall, camera settings, forward and side overlap, and a set of oblique passes facing the benches. The oblique images serve two purposes. They image the steep faces that vertical photographs barely see, and they strengthen the camera calibration against doming (James and Robson, 2014). The mission is flown at the same time of day each week so that shadows fall alike. Repeating the same geometry does not remove systematic error, but it makes much of it common to every epoch, so that it cancels when epochs are differenced.
3.4. Step 4: Process with frozen settings
Each week's images are processed in the same software version with the same parameters. Images that are blurred or badly exposed are removed first. After bundle adjustment the residuals on the check points are examined, and a survey whose residuals exceed a tolerance set in advance is reflown, not repaired. The products are a dense point cloud, an orthomosaic and a processing report, all archived with the raw images so that any epoch can be reprocessed later. Reporting follows the recommendations for structure-from-motion surveys made by James et al. (2019).
3.5. Step 5: Co-register on stable ground
Even with good control, two epochs will differ by a small rigid shift and tilt. Each new cloud is therefore fine-aligned to the baseline using only the reference patches, by an iterative closest point adjustment. The mean and spread of the distances remaining on those patches after alignment become the registration error carried into the next step. If a reference patch itself shows a consistent offset over several weeks, it is no longer stable and is replaced.
3.6. Step 6: Detect change above the level of detection
M3C2 distances are computed between the baseline and the current epoch, and between consecutive epochs, with normals estimated at a scale larger than the surface roughness of a blasted face (Lague et al., 2013). Distances that fall inside the confidence interval are masked. Areas that have been mined, dumped on or scaled since the previous flight are also masked, using the short-term mine plan, because excavation is change but not deformation. Horizontal displacement vectors are obtained by correlating the two orthomosaics over the unmasked area. Agreement between the two measures, a face moving outward and a crest moving in the same direction, is itself evidence that the signal is real.
3.7. Step 7: Build time series and act on them
The wall is divided into zones that follow the structural domains, and for each zone the median displacement is added to a running series. Cumulative displacement and weekly rate are plotted with their uncertainty. The series are reviewed against the trigger levels in the mine's trigger action response plan. The response this article proposes to a breach is modest by design: inspect the bench, and move a higher-frequency instrument onto it. Weekly photogrammetry is a means of deciding where to look more closely, and its results should always be compared with any prism or radar data covering the same ground (Dick et al., 2015).
4. Fitting the Procedure to a Working Pit
A weekly interval suits the planning rhythm of most mines and the endurance of small aircraft, and it keeps the processing load to something one surveyor can manage. Flights are scheduled between blasts and when dust has settled, and wind limits are observed, because image blur degrades matching far more than it degrades a volume survey. Aviation rules, exclusion zones around working equipment and the mine's own procedures for airspace remain in force. Vegetation, which troubles photogrammetric monitoring of natural slopes (Turner et al., 2015), is rarely an issue on active benches, but wet faces, snow and deep shadow change the appearance of the rock and can defeat feature matching and correlation alike.
5. Limitations and What Remains to Be Shown
The procedure is proposed, not proven. Its central claim, that a fixed design and co-registration on stable ground will bring the level of detection low enough to see bench-scale movement at an early stage, needs testing against instruments of known accuracy. A fair trial would fly a wall already monitored by prisms or radar for several months, compare displacements zone by zone, and include targets moved by known amounts between flights. It should also record how often surveys are lost to weather, since a monitoring system that is frequently unavailable has limited value.
Some limits are inherent and no trial will remove them. One survey a week cannot follow a slope in its final acceleration, when rates may multiply within hours, and inverse-velocity forecasts made from so few points would be unreliable (Rose and Hungr, 2007). The method therefore has no role as an alarm. Its precision is of the order of centimetres, against the sub-millimetre sensitivity of radar. And it sees only the surface: it says nothing about pore pressure or movement at depth, which the wider monitoring system must supply (Read and Stacey, 2009).
6. Conclusion
Mines already own the aircraft, the software and the survey skills needed to measure bench deformation from the air. What has been lacking is a disciplined way of separating movement from error. The seven steps proposed here supply one by holding the survey design constant, anchoring every epoch to stable ground and reporting only change that exceeds a stated level of detection. Used as a weekly screening layer beneath radar and prisms, the method could extend coverage to benches that now go unmeasured. Whether it does so reliably is a question for field trials of the kind outlined above.
Conflict of interest
To be declared by the author(s) before publication.
Funding
To be declared by the author(s) before publication.